Collaboration Statistics: 30 Stats (2026) | The Collaborative Organization
By The Collaborative Organization Team · November 19, 2026 · Last verified November 19, 2026 · 11 min read
Collaboration statistics show that a small share of people does most of the joint work, and more than half the week goes to coordination. The 30 numbers below come from research papers and large surveys, each with its source and year.
Key takeaways
- Collaborative time rose by more than 50% over two decades, Harvard Business Review found in 2016.
- Two-thirds of the $900 billion to $1.3 trillion value McKinsey saw in social technologies came from better communication and collaboration in 2012.
- Team papers in science and engineering were 6.3 times more likely than solo papers to reach 1,000 citations, Wuchty and colleagues found in 2007.
- Home workers in the 2015 Ctrip trial scored 13% higher on performance, and far fewer of them quit.
- “Work about work” takes 58% of the workday, Asana found in 2023, leaving 33% for skilled work and 9% for strategy.
How we chose these 30 statistics
We took each number from the paper, report, or dataset that first published it, and we checked it against that source on 19 November 2026. We used the original study, not a roundup, so every figure below names the publisher that produced it.
Older studies stay in when they are still the original source of a figure people quote, and vendor surveys are named as vendor surveys. Modelled estimates are flagged as estimates, and figures we could not trace to a named source were left out.
Our companion guide on workplace collaboration statistics covers meetings and messages in more depth.
Collaboration keeps growing, and a few people carry it
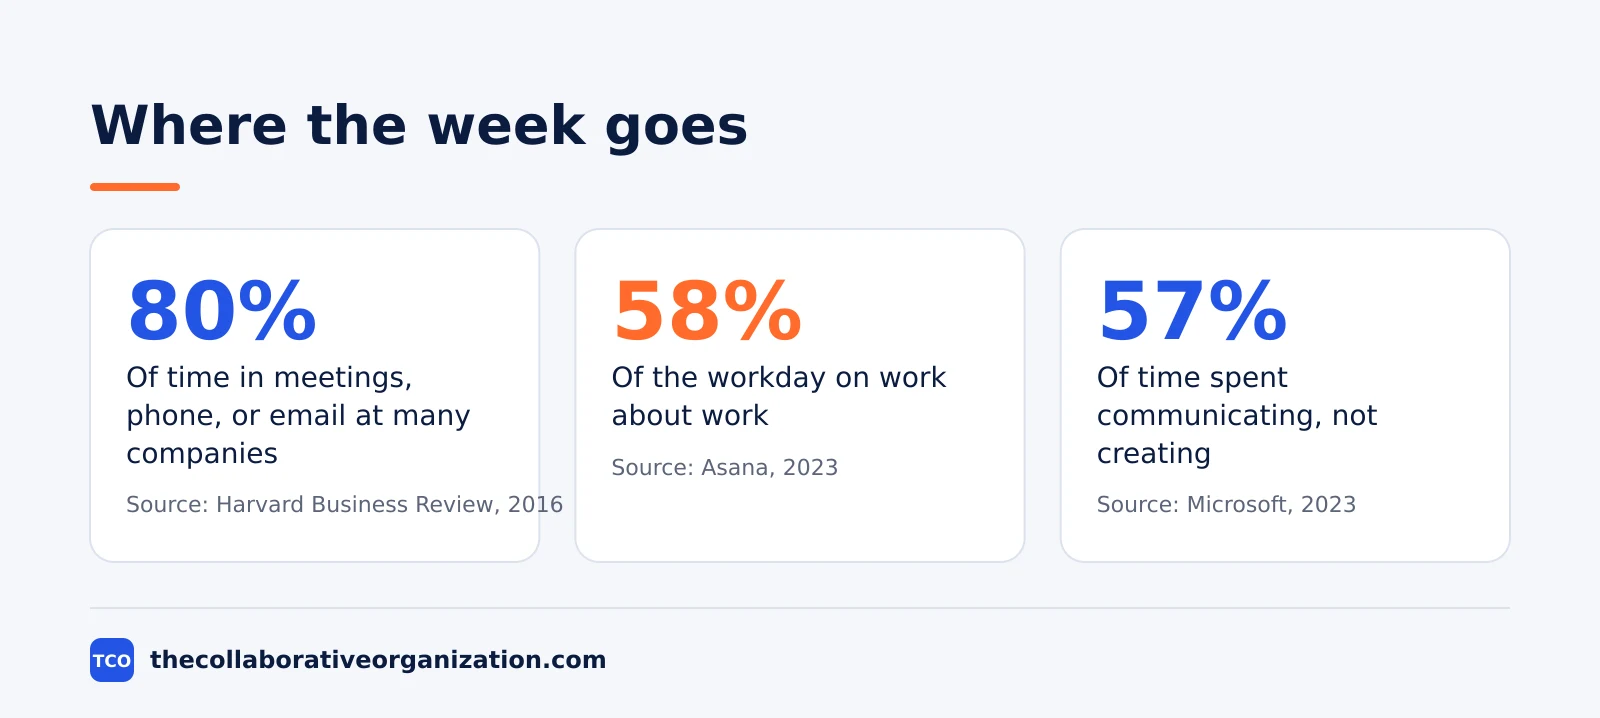
The time people spend working with others rose by more than half over two decades, Harvard Business Review reported in 2016. At many companies, staff spent about 80% of their time in meetings, on the phone, or answering email. The study covered more than 300 organizations.
The load falls on few shoulders. Only 3 to 5% of employees account for 20 to 35% of the value-added collaborations, the study found. The same people also tend to be the top performers: about half of the highest collaborators are also among the highest performers.
Not every star helps. About 20% of the top performers in the study did little to help colleagues, and the authors warn that the most sought-after helpers can be hurt by too many requests. Their advice is to protect the time of the people everyone turns to, and to spread the load.
What better collaboration is worth
McKinsey Global Institute estimated in 2012 that social technologies could create $900 billion to $1.3 trillion a year in value across four industry sectors. Two-thirds of that value came from better communication and collaboration inside and between companies, not from marketing or customer service.
The gains show up in hours. The report estimated 25 to 30% of email time could be put to other uses if teams shared work in open channels instead of inboxes. It also estimated 30 to 35% of the time spent searching for information could be freed by a searchable store of messages.
The split varies by industry. In professional services, 98% of the potential benefit came from collaboration, the highest share of any sector in the study. The average across the sectors studied was 66%.
Our guide on collaboration tools statistics covers the tools teams use to share work.
Teams now do the best science
Team papers dominate science, and the shift is decades old. Wuchty, Jones, and Uzzi studied 19.9 million papers and 2.1 million patents for Science in 2007. In the social sciences, the share of papers written in teams rose from 17.5% in 1955 to 51.5% in 2000.
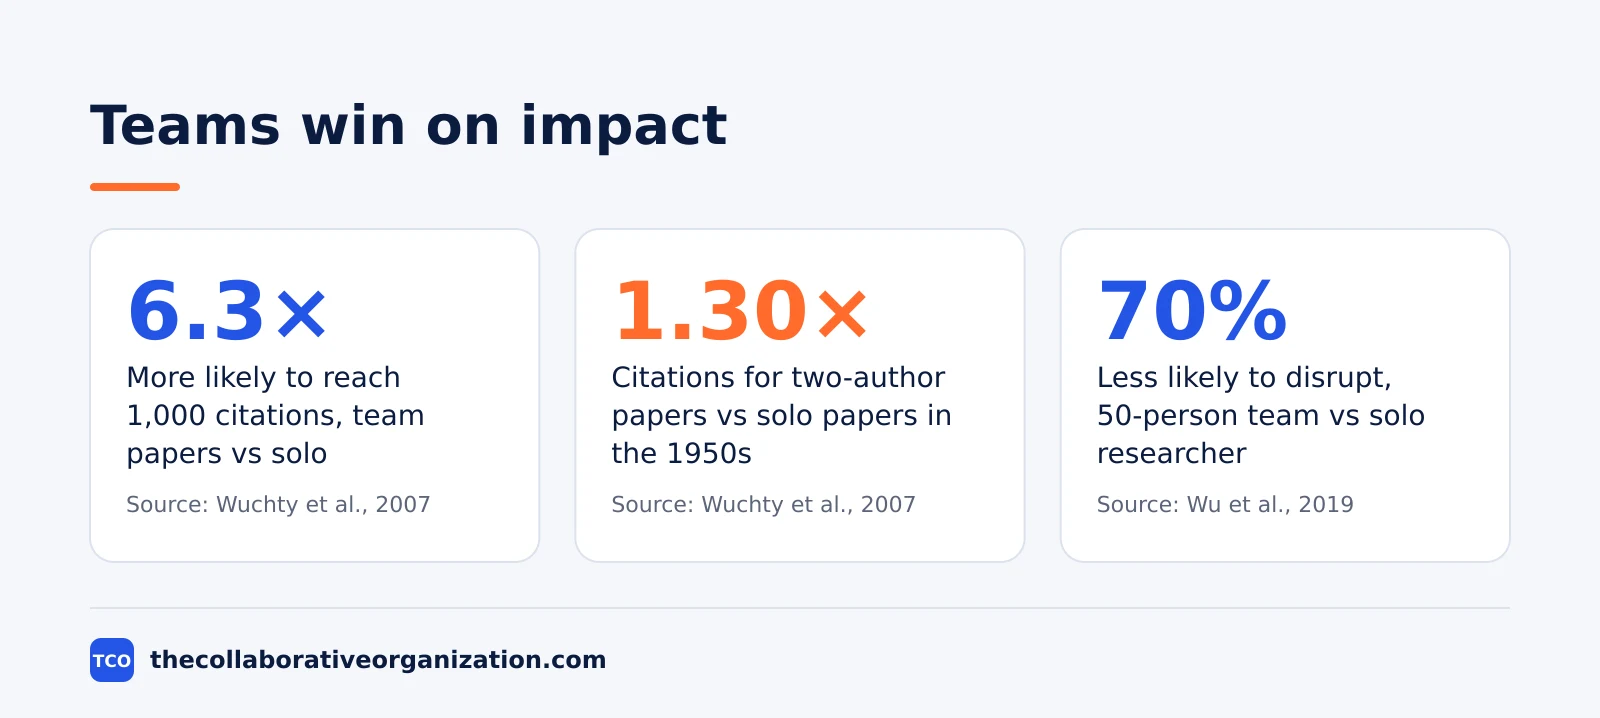
Teams also grow. In science and engineering, the average team rose from 1.9 to 3.5 authors per paper over 45 years. Two-author papers earned 1.30 times as many citations as solo papers in the 1950s, and the gap widened to 1.74 times by the 1990s.
The biggest impact belongs to teams too. A team paper in science and engineering was 6.3 times more likely than a solo paper to receive at least 1,000 citations. The pattern held even after the authors removed self-citations from the counts.
Big teams have a trade-off. Wu, Wang, and Evans studied more than 65 million papers, patents, and software products for Nature in 2019. They found a 50-person team was about 70% less likely to produce disruptive work than a solo researcher, while small teams were the ones that broke new ground.
Papers that won Nobel prizes sat in the top 2% for disruption in the same study.
Remote work changed who talks to whom
When Microsoft sent its US staff home in 2020, people spent about 25% less time collaborating with colleagues in other groups. Yang and colleagues studied 61,182 Microsoft employees over the first six months of 2020 for Nature Human Behaviour in 2022. Meeting hours fell by about 5%, and networks grew more siloed.
Working from home can still raise output. In a 2015 trial at Ctrip, home workers scored 13% higher on performance than office workers over nine months, Bloom and colleagues reported in the Quarterly Journal of Economics. The gain came from more minutes worked and more calls per minute.
Home workers also stayed longer. Attrition in the Ctrip trial was 17.0% for home workers against 35.0% for office workers over the nine months. When the company later let staff choose, the performance gain rose to about 22%.
Hybrid work kept people without hurting output. In a 2024 trial of 1,612 employees with two home days a week, Bloom, Han, and Liang found no effect on performance grades or promotions, Nature reported. Resignations fell by a third, from 7.20% to 4.80%.
Our guide on remote work productivity statistics covers the Ctrip trial in more depth.
Where the working day goes
Asana’s 2023 survey of 9,615 knowledge workers found 58% of the workday goes to “work about work”: duplicated work, needless meetings, and juggling too many apps. Skilled work took 33% of the day, and strategic work took just 9%. The survey ran in late 2022 across six countries.
Collaboration that works pays. At organizations with strong cross-team collaboration, 55% of workers said revenue had grown over the past three years, against 28% at weak collaborators. The same split showed in purpose: 92% of workers at strong collaborators said their work had value, against 50% at weak ones.
Microsoft’s 2023 Work Trend Index found a similar split of the day. Workers spent 57% of their time communicating and 43% creating, and 68% said they lacked enough uninterrupted time to focus. The survey covered 31,000 people in 31 countries.
For the meeting share of the week, see our guide on meeting statistics.
When communication breaks down
Poor communication stalls work more often than it loses sales, the Economist Intelligence Unit found in 2018. In a survey of 403 US executives, managers, and junior staff, 44% said communication problems caused delays or failures in completing projects.
The costs run past the schedule. The same survey found 18% of respondents had lost sales to poor communication, and 52% said it added stress to their work. About 30% of the lost sales were valued at $100,000 to $999,999.
The causes are ordinary. Different communication styles topped the list at 42%, followed by unclear responsibilities at 34% and time pressure at 31%. The fixes are ordinary too: clearer roles, one channel for decisions, and a written record.
What the numbers mean
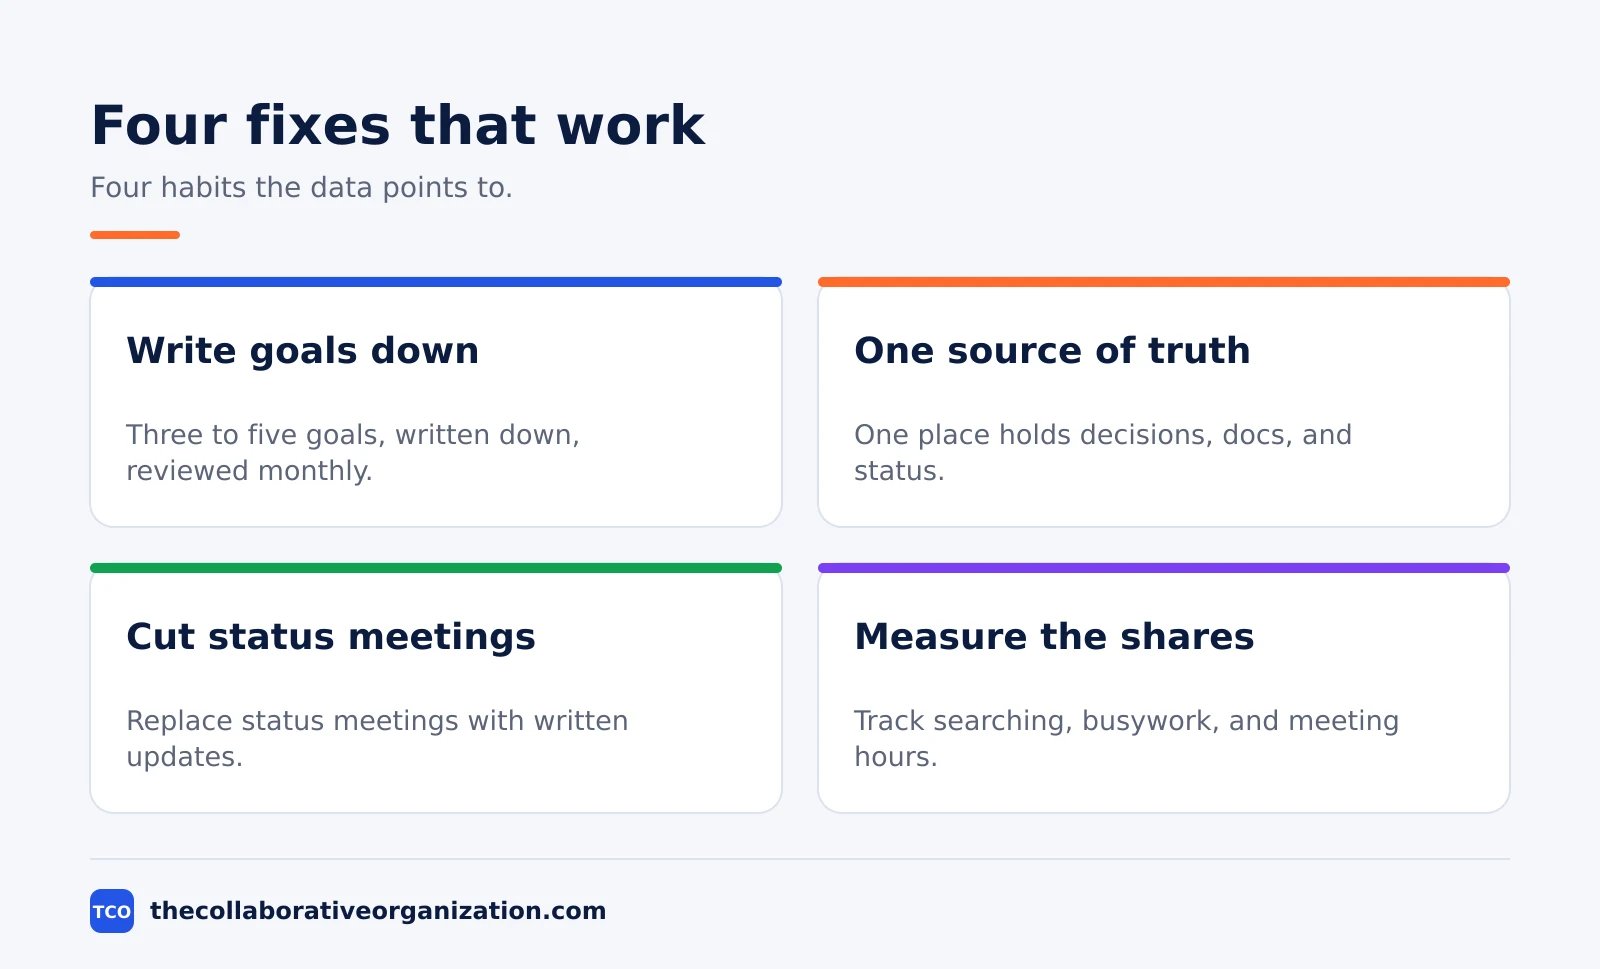
The numbers point the same way: collaboration helps, but only when it is aimed at the work that matters. A small group carries most of the joint work, most of the week goes to coordination, and the best teams protect focus time. For the working definition, see our guide on what team collaboration is.
Picture a 40-person team on 40-hour weeks. At Asana’s 58% figure, the team spends about 928 hours a week on coordination. Cutting that share by 5 points frees about 80 hours a week, close to two full-time roles. The numbers in this example are an illustration, built from the figures above.
The test for any change is simple: measure the shares before and after. A team that tracks its week in a tool such as Asana can see the split directly, and can tell whether a new habit moved it.
Our guide on how to improve team collaboration turns these habits into a step-by-step plan.
Common mistakes when quoting collaboration statistics
- Quoting McKinsey’s 20 to 25% productivity figure as a promise. It is a modelled estimate of what better tools could add, not a measured gain.
- Mixing up Asana’s figures. The 58% share of the day on coordination comes from the 2023 report, while the 60% figure comes from a later survey. Check the year before you quote either one.
- Treating a modelled estimate as a measured loss. McKinsey’s dollar figures are estimates built from surveys, so present them as the scale of the issue, not as money already lost.
- Citing a roundup instead of the original study. The figures above link to the original publisher, so a reader can check each one.
- Comparing shares from different years as if they were one trend. Each survey below names its year, and the table keeps them apart.
The 30 collaboration statistics
The table below lists 30 statistics from the reports above, grouped by theme, with the source and the year for each one. Use it to check a figure before you quote it. Every number in the table also appears in the text above with a link to its source.
| Statistic | Source | Year |
|---|---|---|
| Collaborative time rose by more than 50% over two decades | Harvard Business Review | 2016 |
| At many companies, staff spent about 80% of their time in meetings, on the phone, or answering email | Harvard Business Review | 2016 |
| Only 3 to 5% of employees account for 20 to 35% of value-added collaborations | Harvard Business Review | 2016 |
| About half of the top collaborators are also among the top performers | Harvard Business Review | 2016 |
| About 20% of top performers did little to help colleagues | Harvard Business Review | 2016 |
| Social technologies could create $900 billion to $1.3 trillion a year in value across four sectors | McKinsey Global Institute | 2012 |
| Two-thirds of that value came from better communication and collaboration | McKinsey Global Institute | 2012 |
| 25 to 30% of email time could be put to other uses | McKinsey Global Institute | 2012 |
| 30 to 35% of information-search time could be freed | McKinsey Global Institute | 2012 |
| In professional services, 98% of the potential benefit came from collaboration | McKinsey Global Institute | 2012 |
| Team-authored papers in the social sciences rose from 17.5% in 1955 to 51.5% in 2000 | Wuchty, Jones, and Uzzi | 2007 |
| Average team size in science and engineering rose from 1.9 to 3.5 authors per paper over 45 years | Wuchty, Jones, and Uzzi | 2007 |
| Two-author papers earned 1.30 times the citations of solo papers in the 1950s | Wuchty, Jones, and Uzzi | 2007 |
| A team paper in science and engineering was 6.3 times more likely than a solo paper to reach 1,000 citations | Wuchty, Jones, and Uzzi | 2007 |
| A 50-person team was about 70% less likely to produce disruptive work than a solo researcher | Wu, Wang, and Evans | 2019 |
| Papers that won Nobel prizes sat in the top 2% for disruption | Wu, Wang, and Evans | 2019 |
| Microsoft staff spent about 25% less time collaborating with colleagues in other groups after the shift to remote work | Yang et al. | 2022 |
| Meeting hours fell by about 5% in the same period | Yang et al. | 2022 |
| Home workers in the Ctrip trial scored 13% higher on performance than office workers over nine months | Bloom et al. | 2015 |
| Attrition was 17.0% for home workers against 35.0% for office workers in the trial | Bloom et al. | 2015 |
| In the hybrid trial, resignations fell by a third, from 7.20% to 4.80% | Bloom, Han, and Liang | 2024 |
| Hybrid work had no effect on performance grades or promotions in the trial | Bloom, Han, and Liang | 2024 |
| “Work about work” takes up 58% of the workday | Asana | 2023 |
| Skilled work takes 33% of the day, and strategic work takes 9% | Asana | 2023 |
| 55% of workers at strong collaborators reported revenue growth over three years, against 28% at weak collaborators | Asana | 2023 |
| Workers spent 57% of their time communicating and 43% creating | Microsoft | 2023 |
| 68% of workers said they lacked enough uninterrupted time to focus | Microsoft | 2023 |
| 44% of executives said poor communication caused delays or failures in projects | Economist Intelligence Unit | 2018 |
| 18% said poor communication had lost sales | Economist Intelligence Unit | 2018 |
| 52% said poor communication added stress to their work | Economist Intelligence Unit | 2018 |
Sources
- Harvard Business Review - Collaborative Overload (2016)
- McKinsey Global Institute - The Social Economy (2012)
- Wuchty, Jones, and Uzzi - The Increasing Dominance of Teams in Production of Knowledge (2007)
- Wu, Wang, and Evans - Large teams develop and small teams disrupt science and technology (2019)
- Yang et al. - The effects of remote work on collaboration among information workers (2022)
- Bloom et al. - Does Working from Home Work? Evidence from a Chinese Experiment (2015)
- Bloom, Han, and Liang - Hybrid working from home improves retention without damaging performance (2024)
- Asana - Anatomy of Work Global Index 2023 (2023)
- Microsoft - Work Trend Index: Will AI Fix Work? (2023)
- Economist Intelligence Unit - Communication barriers in the modern workplace (2018)
Frequently asked questions
How much of the week goes to collaboration?
More than half, by two measures. Harvard Business Review found in 2016 that collaborative work had risen by over 50% in two decades, and that staff at many companies spent about 80% of their time in meetings, on the phone, or on email. Asana found in 2023 that 58% of the workday goes to work about work, such as duplicated tasks and needless meetings.
Do teams really do better work than people working alone?
In science, yes. Wuchty, Jones, and Uzzi found in 2007 that team papers earned more citations than solo papers in every field they studied, and that a team paper was 6.3 times more likely to reach 1,000 citations. Large teams are the exception: Wu, Wang, and Evans found in 2019 that a 50-person team was about 70% less likely to produce disruptive work than a solo researcher.
Does working from home hurt collaboration?
It changes it. Yang and colleagues found in 2022 that Microsoft staff spent about 25% less time collaborating with colleagues in other groups after the shift to remote work. Output did not fall: home workers in a 2015 Ctrip trial scored 13% higher on performance, and a 2024 hybrid trial found no effect on performance grades while resignations fell by a third.
What is better collaboration worth to a business?
McKinsey Global Institute estimated in 2012 that social technologies could create $900 billion to $1.3 trillion a year in value across four sectors, with two-thirds of it coming from better communication and collaboration. Asana found in 2023 that 55% of workers at strong collaborators reported revenue growth over three years, against 28% at weak collaborators.
Can I cite these statistics?
Yes. Cite the original source linked beside each number, with its date, so readers can check it. Every figure in this article comes from the paper, report, or dataset that first published it, and each one was checked against that source on 19 November 2026. Figures we could not trace to a named source were left out.
Related articles
guides
Free Project Management Templates: 7 to Copy (2026)
Seven free project management templates from monday, Wrike, Teamwork, Smartsheet, ClickUp, Asana and Trello, with what each one is for and what free really costs.
November 20, 2026 · 7 min read
guides
Project Proposal Template: Copy and Win Work (2026)
A project proposal template pitches the work before it is approved: problem, solution, scope, budget, timeline and terms. Copy the template and filled example.
November 20, 2026 · 10 min read
guides
Action Plan Template: Goal to Done in One Page (2026)
An action plan template turns one goal into owned steps with dates, dependencies and a success measure. Copy the table and see it filled for a support team.
November 20, 2026 · 11 min read