Collaboration Tools Statistics: 45 Stats (2026) | The Collaborative Organization
By The Collaborative Organization Team · November 19, 2026 · Last verified November 19, 2026 · 16 min read
Collaboration tools statistics show a split picture: teams adopt more tools every year, yet they still lose a quarter of the week searching for information and half their time on busywork. The numbers below come from the original reports where possible, and each figure names its source and year so you can check it yourself.
Key takeaways
- Microsoft’s 2025 survey: 82% of leaders call 2025 a pivotal year, and 81% expect AI agents in their AI strategy within 12 to 18 months.
- Atlassian’s 2025 survey: teams spend 25% of the workweek searching for information.
- Zoom’s 2025 data: 54% of employees using more than 10 apps report communication issues, against 34% using fewer than five.
- Bad collaboration costs up to $16,491 a year per manager, Zoom and Morning Consult estimated in 2024.
- The collaboration software market was worth $18.2 billion in 2024, and the UCaaS market reached $23.0 billion in 2025.
How we chose these stats
We took every number in this article from the publisher’s own report, press release, or dataset, or from a roundup that names the original source, and we checked each one against that source on 19 November 2026. We used the latest edition of each yearly report that includes the figure. Vendor surveys are flagged as vendor surveys, and modelled estimates are flagged as estimates.
Some figures come second-hand and are flagged in the text: Project.co, Corel, Staffbase, Forbes, Buffer, FlexJobs, Gensler, and Culture Amp figures reach us through Zoom’s 2025 roundup, which names each source; Verizon and IBM figures come from summaries of reports that sit behind registration walls.
Figures we could not trace to a named source were left out, including the popular claim that teams are 50% more productive, which traces to a 2014 experiment that measured persistence, not productivity.
Our companion guide on workplace collaboration statistics covers meetings, messages, and engagement in more depth, with 40 figures from the same family of reports. This article focuses on the tools themselves: adoption, app sprawl, AI features, market size, and cost.
How teams use collaboration tools
Teams now run most of their work through a mix of chat, docs, and project tools, and AI features are moving from add-on to default. The figures below show adoption rising fast while training and habits lag behind.
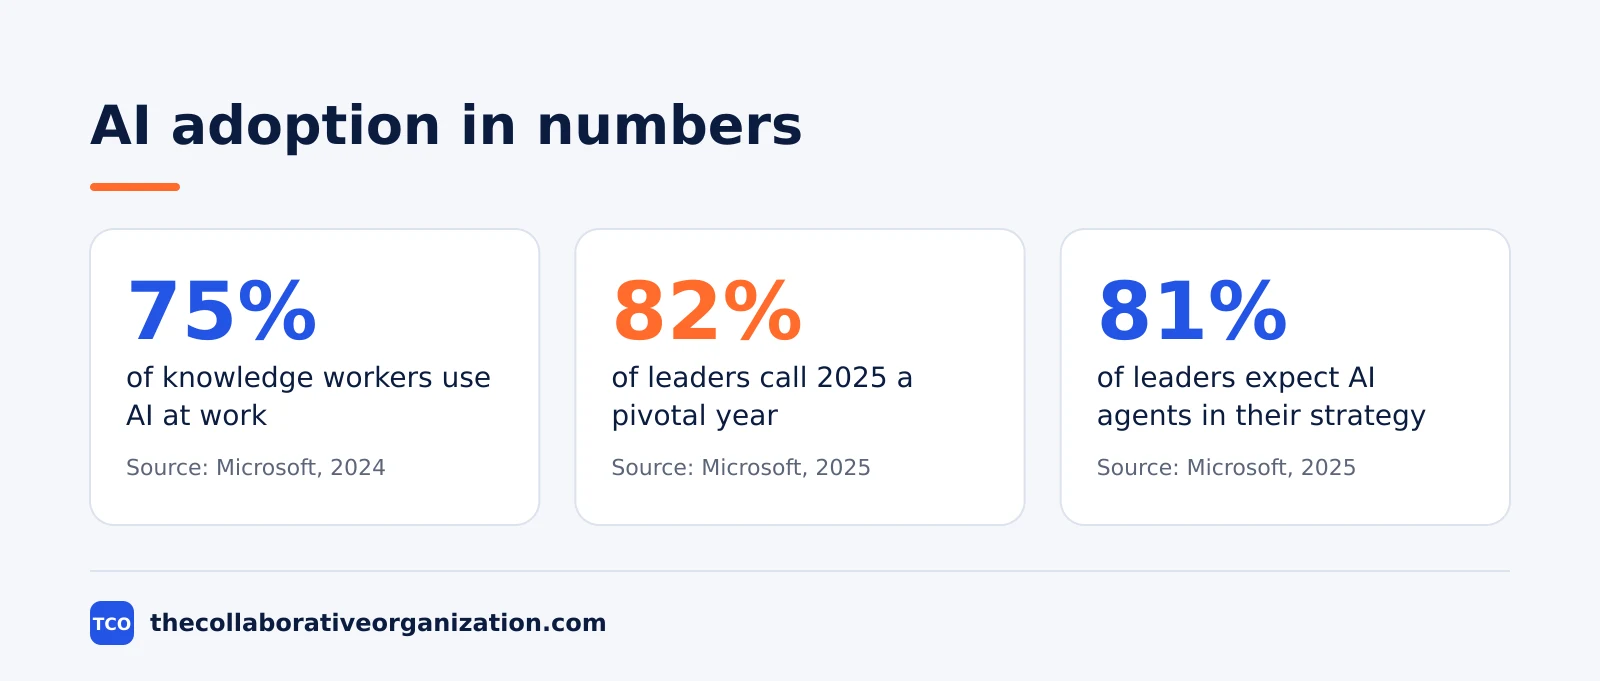
Leaders expect AI to change the stack, not just add to it. In Microsoft’s 2025 Work Trend Index, a survey of 31,000 workers in 31 countries, 82% of leaders said 2025 is a pivotal year to rethink strategy and operations.
In the same survey, 81% of leaders expect AI agents to be moderately or extensively part of their AI strategy within 12 to 18 months, and 46% said their organizations already use agents to fully automate workflows. Yet only 40% of employees are familiar with AI agents, against 67% of leaders.
Email still leads as the daily channel. Zoom’s 2025 roundup of workplace statistics reports Project.co figures showing 36% of professionals use email most to talk with coworkers, 26% use an online chat tool, and only 6% rely mainly on phone or face-to-face talk.
The same roundup reports Morning Consult figures for Zoom: 71% of leaders see a positive impact on happiness from hybrid and remote work, and 75% of leaders whose teams use AI say their teams collaborate better.
Gensler found office workers spend 42% of their time collaborating on average, and Culture Amp found 72% of remote workers report open, honest two-way communication, against 67% of in-office workers and 64% of hybrid workers.
Employers back the tools even when the experience is uneven. In [Cisco’s 2025 hybrid work study](https://www.computerweekly.com/news/366625707/Cisco-Live-2025-The-digital-workplace-gets-closer-to-distance-zero) of 21,513 employers and employees in 21 markets, 93% of employers said collaboration tools are important, and 63% of workers said they would accept a pay cut to work remotely more often.
Hybrid arrangements fell from 62% of respondents in 2022 to 45% in 2025, so the tools now serve a mix that leans back toward the office.
Adoption of AI at work is already broad. In Microsoft and LinkedIn’s 2024 Work Trend Index, 75% of knowledge workers said they use AI at work, and 78% of those users bring their own AI tools to work. Only 39% of AI users had received AI training from their company, which means most people learn the tools alone.
Our AI in the workplace statistics guide tracks how that gap shows up in output.
The newest Project.co numbers show the same strain. Project.co’s Communication Statistics 2026, quoted by Pumble, found 53% of respondents wasted time at work due to communication issues, 46% missed messages, 26% lost files, and 40% experienced burnout, stress, and fatigue due to workplace communication issues.
Email was the most popular tool for internal communication at 33% and for external communication at 53%.
The cost of too many tools
More tools do not mean better collaboration: the data shows communication breaks down as the app count rises, and searching eats the time the tools were meant to save. Five figures from five publishers make the same point.
App sprawl has a measurable cost. Zoom’s 2025 figures show employees using more than 10 apps report communication issues at a rate of 54%, against 34% for those using fewer than five apps. Each new app adds a place to check, a login to keep, and a thread that lives outside the main flow of work.
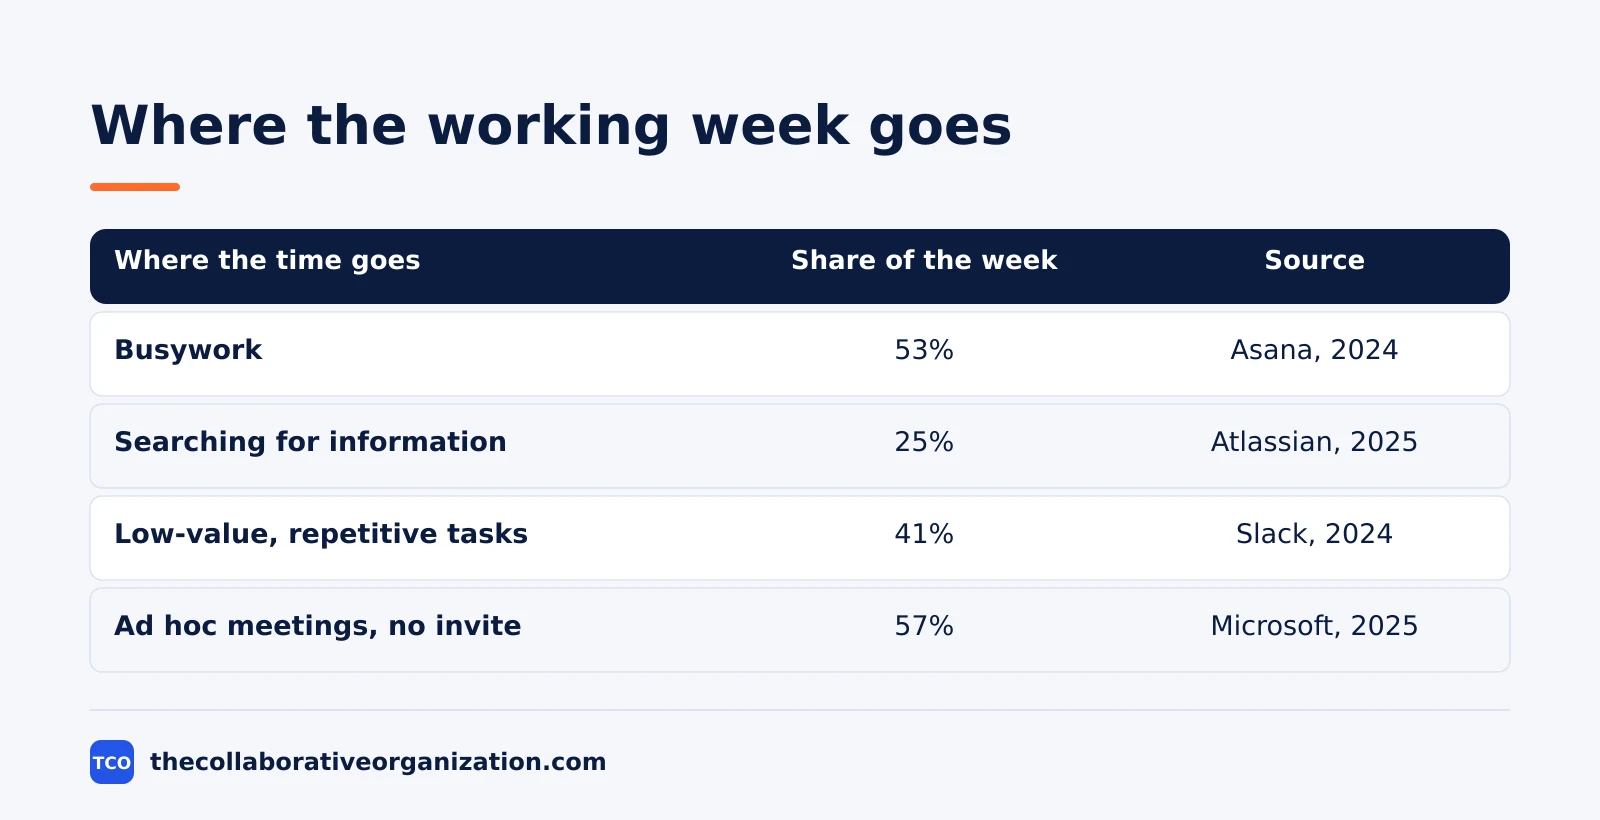
Searching is the tax on a scattered stack. In Atlassian’s State of Teams 2025, a survey of 12,000 knowledge workers and 200 Fortune 1000 executives, teams spend 25% of the workweek searching for information, and difficulty finding information was the top barrier to moving fast.
In the same survey, 56% of knowledge workers said they often have to ask someone or book a meeting to get the information they need.
Busywork takes the rest. Asana’s State of Work Innovation 2024, a survey of 13,066 knowledge workers in six countries, found 53% of time goes to busywork, and unproductive meetings take 5 hours a week per knowledge worker, double the figure from August 2019.
Chasing status, searching for files, and communicating about work leave less than half the week for skilled work.
Chat carries much of the low-value load. Slack’s Workforce Lab found in 2024 that desk workers spend 41% of their time on low-value, repetitive tasks, in a survey of 10,281 desk workers. Chat in Slack is where much of that work shows up as messages that could have been a written update or a task.
The message load behind those shares is large. Microsoft’s 2025 telemetry shows the average worker receives 117 emails a day and 153 Teams messages per weekday, and the heaviest users are interrupted every 2 minutes, about 275 pings a day. In the same data, 57% of meetings are ad hoc calls with no calendar invite.
Our software adoption statistics guide tracks how teams decide which tools earn a place in the stack.
AI in collaboration tools
AI is now the feature vendors use to sell collaboration tools, and the early results favor teams that use it as a teammate rather than a search box. The figures below come from Microsoft’s two most recent Work Trend Index reports and one older McKinsey estimate.
The gap between leaders and staff is the story of 2025. In Microsoft’s 2025 report, 83% of leaders expect AI to let employees take on more complex, strategic work earlier in their careers, while only 67% of employees share that optimism.
The report’s “Frontier Firms”, those with organization-wide AI deployment, show the split clearly: 71% of their workers say the company is thriving, against 37% globally, and 55% say they can take on more work, against 20% globally.
Leaders who already use AI report strong results. In the Morning Consult survey commissioned by Zoom and reported in Zoom’s 2025 roundup, 85% of leaders using AI complete tasks faster, 84% are more productive, and 81% deliver higher quality work. Those are self-reported gains from a vendor-commissioned survey, so read them as direction, not proof.
The long-run prize is older than the current AI wave. The McKinsey Global Institute estimated in 2012 that social technologies could raise the productivity of interaction workers by 20 to 25 percent, in its report on social technologies.
The same report estimated that interaction workers spend about 28% of the workweek on email and nearly 20% looking for internal information or tracking down colleagues. The figure is a modelled estimate of what full adoption could bring, not a measured result, and no newer original exists for that finding.
Hybrid work and the tools it runs on
Hybrid work made collaboration tools essential, but the tools did not fix the isolation that comes with working apart. The figures below show remote workers communicating well and feeling alone at the same time.
Remote workers report better conversations and worse connection. In Zoom’s 2025 roundup, FlexJobs found 36% of employees feel remote work has a negative impact on workplace collaboration, while Buffer found about 30% of remote workers feel unengaged at their job. Gallup found 25% of remote employees experience daily loneliness from a lack of connection, against only 16% of onsite employees.
The tool works; the human contact around it is thinner.
Engagement fell as hybrid settled in. Gallup’s State of the Global Workplace 2025 found only 21% of employees worldwide were engaged at work in 2024, down from 23% in 2023, and estimated the drop cost the global economy $438 billion in lost productivity.
Manager engagement fell from 30% to 27% in the same year, and Gallup notes managers account for about 70% of the variance in team engagement.
The fix is a habit problem as much as a tool problem. Our guide on how to improve team collaboration covers the routines that make hybrid tools work: one written update instead of a status meeting, decisions recorded where the work lives, and a fixed slot for live talk. A tool cannot replace those habits, but it can carry them.
What poor collaboration costs
Poor collaboration costs money in three ways: managers’ time, lost customers, and lost people. The figures below put a number on each one, and the market figures show why vendors keep building tools to fix it.
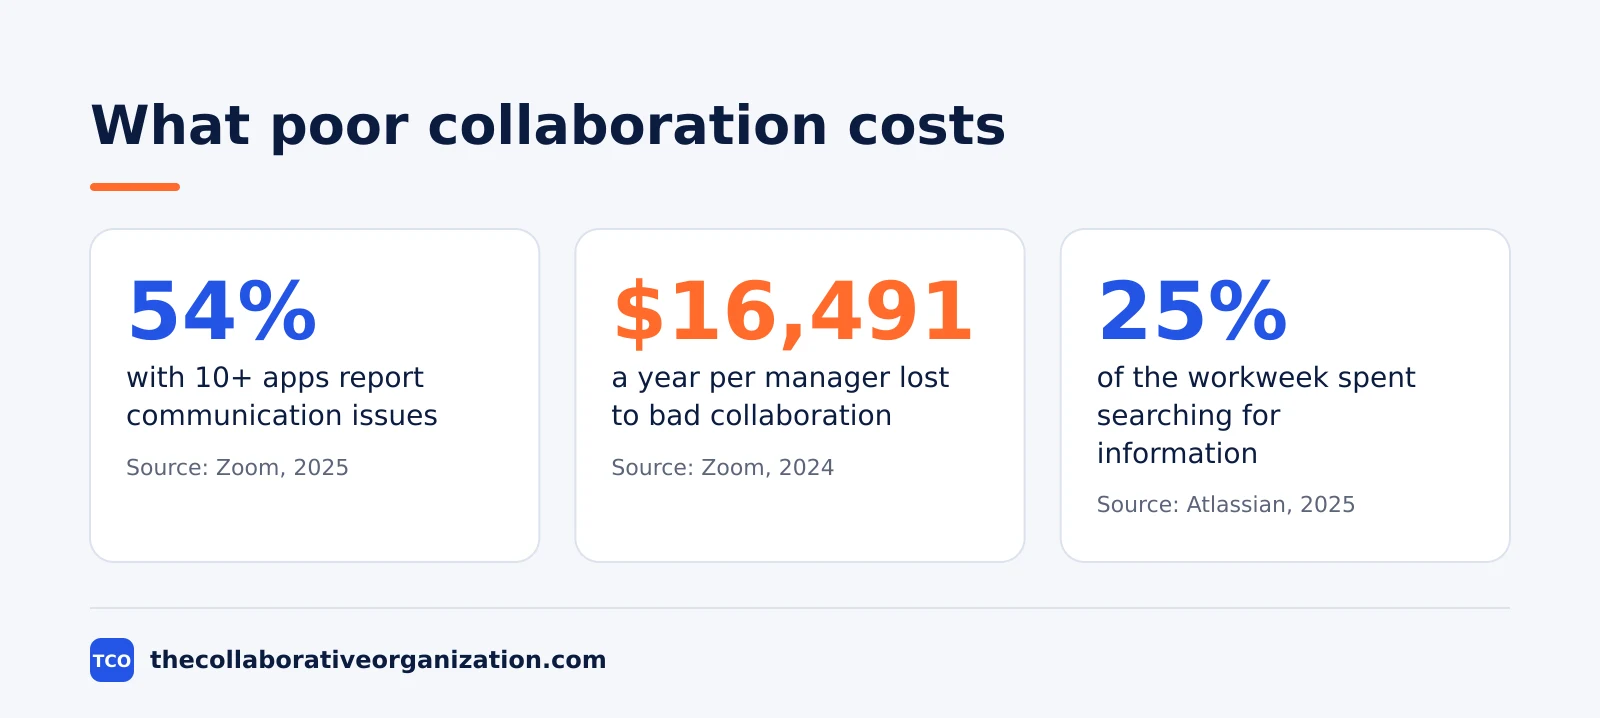
The manager cost is the best measured. Zoom and Morning Consult estimated in 2024 that bad collaboration costs up to $16,491 a year per manager, in a survey of 7,969 knowledge workers in 16 countries, and more than $874,000 a year for an enterprise of 1,000 people.
Both figures are modelled estimates built from survey data and salary averages, not measured losses.
Customers leave over it. In Zoom’s 2025 roundup, Project.co figures show 63% of workers wasted time at work due to communication problems and poor collaboration, and 68% of clients reported switching to competitors due to poor communication skills. A tool that hides status from the client costs renewals, not just hours.
Staff leave over it too.
In the same Zoom 2025 roundup, Corel found about 64% of workers say poor collaboration costs them three or more hours of productivity a week, Staffbase found 61% of employees would likely leave their job because of poor communication and a lack of collaboration, and Forbes found 45% of employees said poor communication affects their ability to trust their coworkers.
Our AI productivity statistics guide looks at whether AI tools change any of those shares.
The market keeps growing anyway. The global collaboration software market was valued at $18.2 billion as of 2024, according to Global Market Insights figures cited in Zoom’s 2025 roundup. Fortune Business Insights, cited by Cake, expects the team collaboration software market to grow from $31.62 billion in 2026 to $68.20 billion by 2034, a compound annual growth rate of 10.1%.
Those are analyst forecasts, not measured sales.
The phone-system side of the market tells the same story. Metrigy reported in 2026 that the UCaaS market grew 6.1% to $23.0 billion in 2025, with Microsoft the market share leader at 22% of UCaaS seats, followed by Cisco, Zoom, and RingCentral.
More than half of users are now on a UCaaS platform, which is why growth in the segment is slowing even as the total rises.
The full statistics table
The table below lists 45 statistics from the reports above, grouped by theme, with the source and the year for each one. Use it to check a figure before you quote it. Every number in the table also appears in the text above with a link to its source.
| Statistic | Source | Year |
|---|---|---|
| 75% of knowledge workers use AI at work | Microsoft Work Trend Index | 2024 |
| 78% of AI users bring their own AI tools to work | Microsoft Work Trend Index | 2024 |
| 39% of AI users received AI training from their company | Microsoft Work Trend Index | 2024 |
| 82% of leaders say 2025 is a pivotal year to rethink strategy | Microsoft Work Trend Index | 2025 |
| 81% of leaders expect AI agents in their AI strategy within 12-18 months | Microsoft Work Trend Index | 2025 |
| 46% of leaders already use AI agents to automate workflows | Microsoft Work Trend Index | 2025 |
| 117 emails received per day on average | Microsoft Work Trend Index | 2025 |
| 153 Teams messages received per weekday | Microsoft Work Trend Index | 2025 |
| 275 interruptions a day for the heaviest users | Microsoft Work Trend Index | 2025 |
| 57% of meetings are ad hoc, with no invite | Microsoft Work Trend Index | 2025 |
| 71% of Frontier Firm workers say their company is thriving, vs 37% globally | Microsoft Work Trend Index | 2025 |
| 25% of the workweek spent searching for information | Atlassian State of Teams | 2025 |
| 56% often ask someone or book a meeting for information | Atlassian State of Teams | 2025 |
| 53% of knowledge workers’ time goes to busywork | Asana State of Work Innovation | 2024 |
| 5 hours a week lost to unproductive meetings | Asana State of Work Innovation | 2024 |
| 41% of time spent on low-value, repetitive tasks | Slack Workforce Lab | 2024 |
| 21% of employees worldwide engaged at work | Gallup State of the Global Workplace | 2025 |
| $438 billion lost productivity from falling engagement | Gallup State of the Global Workplace | 2025 |
| 71% of leaders see a positive impact on happiness from hybrid/remote work | Morning Consult for Zoom | 2025 |
| 75% of leaders whose teams use AI say teams collaborate better | Morning Consult for Zoom | 2025 |
| 85% of leaders using AI complete tasks faster | Morning Consult for Zoom | 2025 |
| 54% of employees using 10+ apps report communication issues, vs 34% using fewer than 5 | Zoom | 2025 |
| 42% of office workers’ time spent collaborating on average | Gensler | 2025 |
| 72% of remote workers report open, honest two-way communication | Culture Amp | 2025 |
| $16,491 a year per manager lost to bad collaboration (modelled) | Zoom and Morning Consult | 2024 |
| $874,000+ a year lost per 1,000-person enterprise (modelled) | Zoom and Morning Consult | 2024 |
| 63% wasted time due to communication problems and poor collaboration | Project.co | 2025 |
| 68% of clients switched to competitors due to poor communication | Project.co | 2025 |
| 46% missed messages due to bad communication | Project.co | 2026 |
| 40% experienced burnout, stress, and fatigue from communication issues | Project.co | 2026 |
| 64% say poor collaboration costs 3+ hours of productivity a week | Corel | 2025 |
| 61% would likely leave their job due to poor communication | Staffbase | 2025 |
| 45% say poor communication affects trust in coworkers | Forbes | 2025 |
| 36% feel remote work has a negative impact on collaboration | FlexJobs | 2025 |
| 30% of remote workers feel unengaged at their job | Buffer | 2025 |
| 93% of employers say collaboration tools are important | Cisco | 2025 |
| 45% had hybrid arrangements in 2025, vs 62% in 2022 | Cisco | 2025 |
| 63% would accept a pay cut to work remotely more often | Cisco | 2025 |
| $18.2 billion global collaboration software market | Global Market Insights | 2024 |
| UCaaS market $23.0 billion in 2025, up 6.1% | Metrigy | 2025 |
| Microsoft holds 22% of UCaaS seats | Metrigy | 2025 |
| 20-25% productivity gain from social tech (modelled) | McKinsey Global Institute | 2012 |
| Human element in 60% of breaches | Verizon DBIR | 2025 |
| Average breach costs $4.44 million; shadow AI adds $670,000 | IBM | 2025 |
| 66% of companies have cloud data exposed to anonymous users | Varonis | 2025 |
What the numbers mean
The numbers point at one problem: the tools grew faster than the habits that make them work. People search for answers, ask for them in chat, or book a meeting to get them, while the tools meant to hold the answers multiply around them.
Security numbers belong in a tool decision too. The human element played a role in about 60% of breaches in Verizon’s 2025 Data Breach Investigations Report, which analyzed 22,052 incidents and 12,195 confirmed breaches. A collaboration tool with weak guest controls adds doors that the breach data says attackers already use.
The cost side is just as direct. IBM’s 2025 Cost of a Data Breach Report put the global average breach cost at $4.44 million, with breaches involving shadow AI costing $670,000 more on average. Staff who bring their own AI tools to work, which 78% of AI users do, can paste company data into tools nobody approved.
Exposure is already broad. Varonis found in 2025 that 66% of companies have cloud data exposed to anonymous users, and 99% have sensitive data exposed to AI tools, in an analysis of 1,000 IT environments and nearly 10 billion files. Tighten sharing before you switch on an AI assistant, not after.
A worked example shows what the numbers mean for one team. Picture a 50-person team where each person loses 5 hours a week to unproductive meetings, Asana’s 2024 figure. That is 250 hours a week, or about 6 full-time roles spent in meetings that add no value.
Cutting those meetings in half returns about 3 roles’ worth of time to skilled work, without buying any new tool. The numbers in this example are an illustration, built from Asana’s 2024 figure.
Use the numbers to pick one fix, not ten. If searching eats a quarter of the week, fix the source of truth first. If the app count is past ten, cut the stack before you add another tool. Compare the options on our project management software shortlist before you buy a tool to fix a habit problem.
Sources
- Microsoft - Breaking Down the Infinite Workday (2025)
- Microsoft and LinkedIn - AI at Work Is Here. Now Comes the Hard Part (2024)
- Atlassian - State of Teams 2025 (2025)
- Asana - The State of Work Innovation 2024 (2024)
- Gallup - State of the Global Workplace 2025 (2025)
- Zoom - 31 Statistics About Collaboration in the Workplace in 2025 (2025)
- Zoom - Global Collaboration in the Workplace (2024)
- Metrigy - Global UCaaS Market Up 6.1% in 2025 (2026)
- Varonis - Data Security Report Reveals 99% of Orgs Have Sensitive Information Exposed to AI (2025)
- Slack - New Slack Research Shows Accelerating AI Use at Work (2024)
Frequently asked questions
How many collaboration tools does a typical team use?
There is no single published count for a typical team, and vendors count tools differently. What the data does show is the cost of piling them up: Zoom found in 2025 that 54% of employees using more than 10 apps report communication issues, against 34% of those using fewer than five. Fewer tools, used well, beats a large stack.
What is the most used workplace communication tool?
Email still leads. Project.co found in its 2025 survey, cited by Zoom, that 36% of professionals use email most to talk with coworkers, followed by online chat tools at 26%. Only 6% rely mainly on phone or face-to-face talk. Chat has grown fast, but email remains the default channel at work.
How much does bad collaboration cost a company?
Zoom and Morning Consult estimated in 2024 that bad collaboration costs up to $16,491 a year per manager, or more than $874,000 a year for a 1,000-person enterprise. Both figures are modelled estimates built from survey data and salary averages, not measured losses, so treat them as the scale of the problem.
Do collaboration tools make teams more productive?
The evidence points to yes when the tools cut searching and rework, and no when they add apps and meetings. Atlassian found teams spend 25% of the week searching for information, while Asana found 53% of time goes to busywork. A tool earns its keep when those two shares fall, so measure them before and after you adopt one.
Can I cite these statistics?
Yes. Cite the original source linked beside each number, with its date, so readers can check it. Every figure in this article comes from the publisher's own report, press release, or dataset, or from a roundup that names its source. Figures we could not trace to a named source were left out.
Related articles

project management
How to Choose Project Management Software (2026)
Pick project management software in seven steps: define the work, count seats, price the real cost, and run a two-week pilot before you pay.
November 19, 2026 · 10 min read
project management
What Is a RACI Matrix? Definition, Roles and Examples (2026)
A RACI matrix maps who is Responsible, Accountable, Consulted and Informed for each task. Learn the four roles, how to build one, and see a worked example.
November 19, 2026 · 9 min read
project management
Daily Standup Meeting Format That Works (2026)
A daily standup is a 15-minute meeting where Developers inspect progress toward the Sprint Goal and plan the next day. Use this format to run one that ends on time.
November 19, 2026 · 10 min read