Asana Statistics: 30+ Stats on Work and Growth (2026) | The Collaborative Organization
By The Collaborative Organization Team · November 19, 2026 · Last verified November 19, 2026 · 14 min read
Asana statistics show that knowledge workers lose more than half their week to coordination, while Asana itself grew revenue 11% to $723.9 million in fiscal 2025. The 30 numbers below come from Asana’s own research and financial results, plus independent studies on the same topics. Each figure names its source and its year, so you can check it yourself.
Key takeaways
- Asana’s 2024 survey of 13,066 knowledge workers found 53% of their time goes to busywork, leaving 47% for skilled work.
- Unproductive meetings take 5 hours a week per knowledge worker, double the figure from August 2019.
- Asana’s fiscal 2025 revenue was $723.9 million, up 11% year over year, with 24,062 Core customers.
- Knowledge workers spend 60% of their time on “work about work”, according to Asana’s Anatomy of Work research.
- Starter costs $10.99 per user per month billed annually as of November 2026, and the Personal plan is free for 2 users.
How we chose these stats
We took every number in this article from the publisher’s own report, press release, or dataset, and we checked each one against that source on 19 November 2026. We used the latest edition of each yearly report that includes the figure. Vendor surveys are flagged as vendor surveys, and modelled estimates are flagged as estimates.
Asana’s research comes in two lines, and they measure different things. The State of Work Innovation 2024 survey puts busywork at 53%, while the Anatomy of Work figures from Asana’s April 2026 research page put “work about work” at 60%. They come from different surveys, so this article keeps them apart and never adds them together.
Revenue and customer figures come from Asana’s fiscal 2025 results release of 10 March 2025, which covers the fiscal year ended 31 January 2025. Where a figure comes from a secondary source, the text says so. Every stat in the table below names its source and the year its data was collected.
Asana by the numbers: revenue and customers
Asana grew revenue 11% in fiscal 2025, and its largest customers grew faster than the rest. The growth came with a first: the company reported its first full year of positive free cash flow.
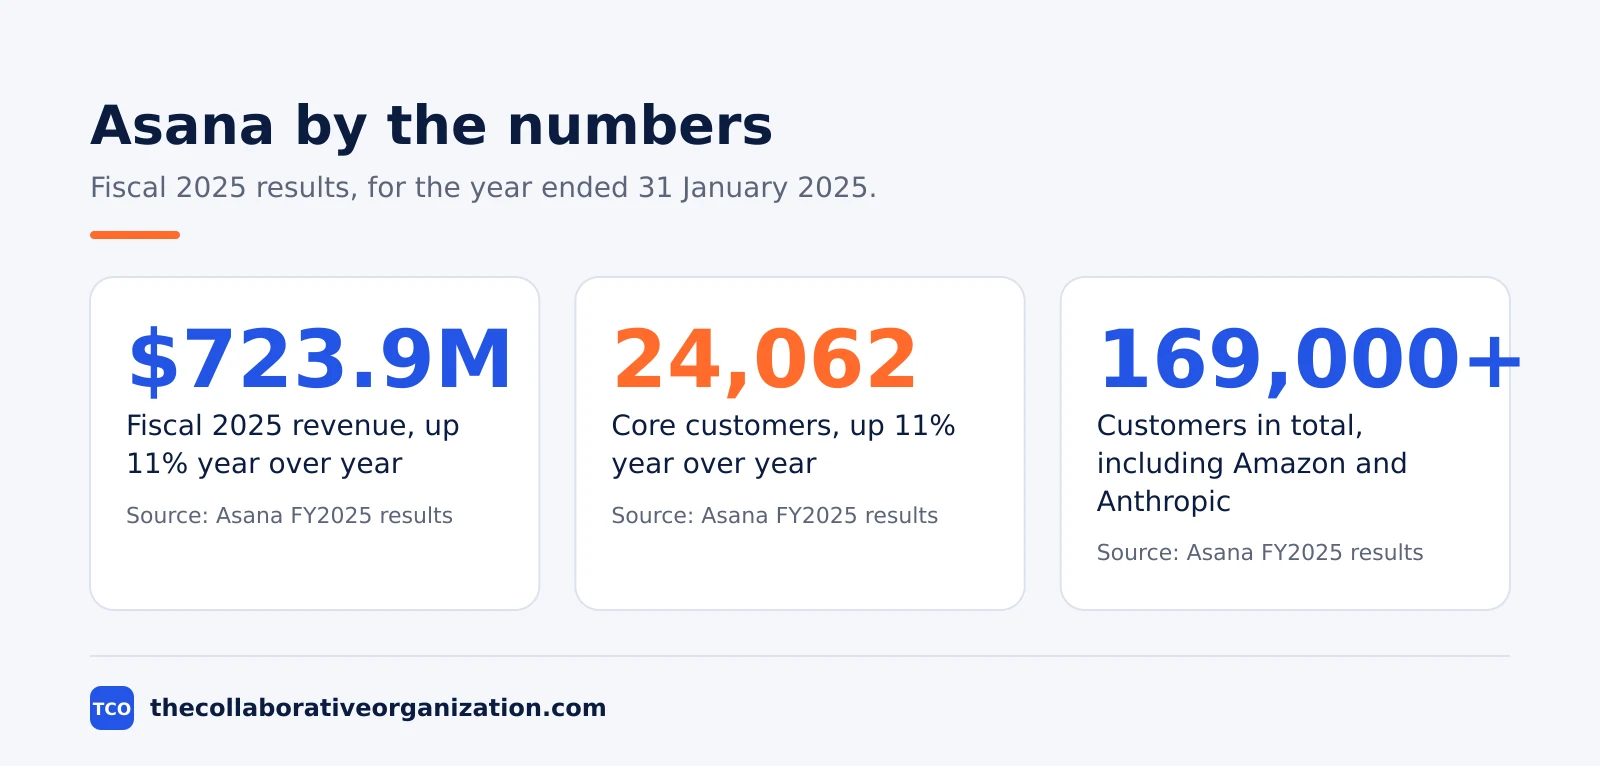
Revenue for fiscal 2025 was $723.9 million, up 11% year over year, according to Asana’s fiscal 2025 results release. Fourth-quarter revenue was $188.3 million, up 10% year over year. The fiscal year ended on 31 January 2025, so these are not calendar-year figures.
Core customers, who spend $5,000 or more a year, grew to 24,062 in the fourth quarter, an increase of 11% year over year, the same results release reports. Revenue from Core customers grew 11% in the quarter and made up 75% of fourth-quarter revenue.
The largest accounts grew fastest. Customers spending $100,000 or more a year reached 726 in the fourth quarter, up 20% year over year, according to the same Asana results. The company added nearly 120 such customers during the year.
Retention held steady. The dollar-based net retention rate was 96% overall in the fourth quarter, and 97% for Core customers, the release reports. A rate below 100% means existing customers spent slightly less in total than the year before.
Asana reported more than 169,000 customers in total, including Amazon, Accenture, Morningstar, Anthropic and Suzuki, according to the fiscal 2025 results. The fourth-quarter non-GAAP operating margin improved by 820 basis points year over year, from a loss margin of 9% to a loss margin of 1%.
Where the working week goes
More than half of a knowledge worker’s week goes to busywork, and only 47% is left for skilled and strategic work. Asana’s 2024 survey of 13,066 knowledge workers in six countries is the source for the figures in this section.
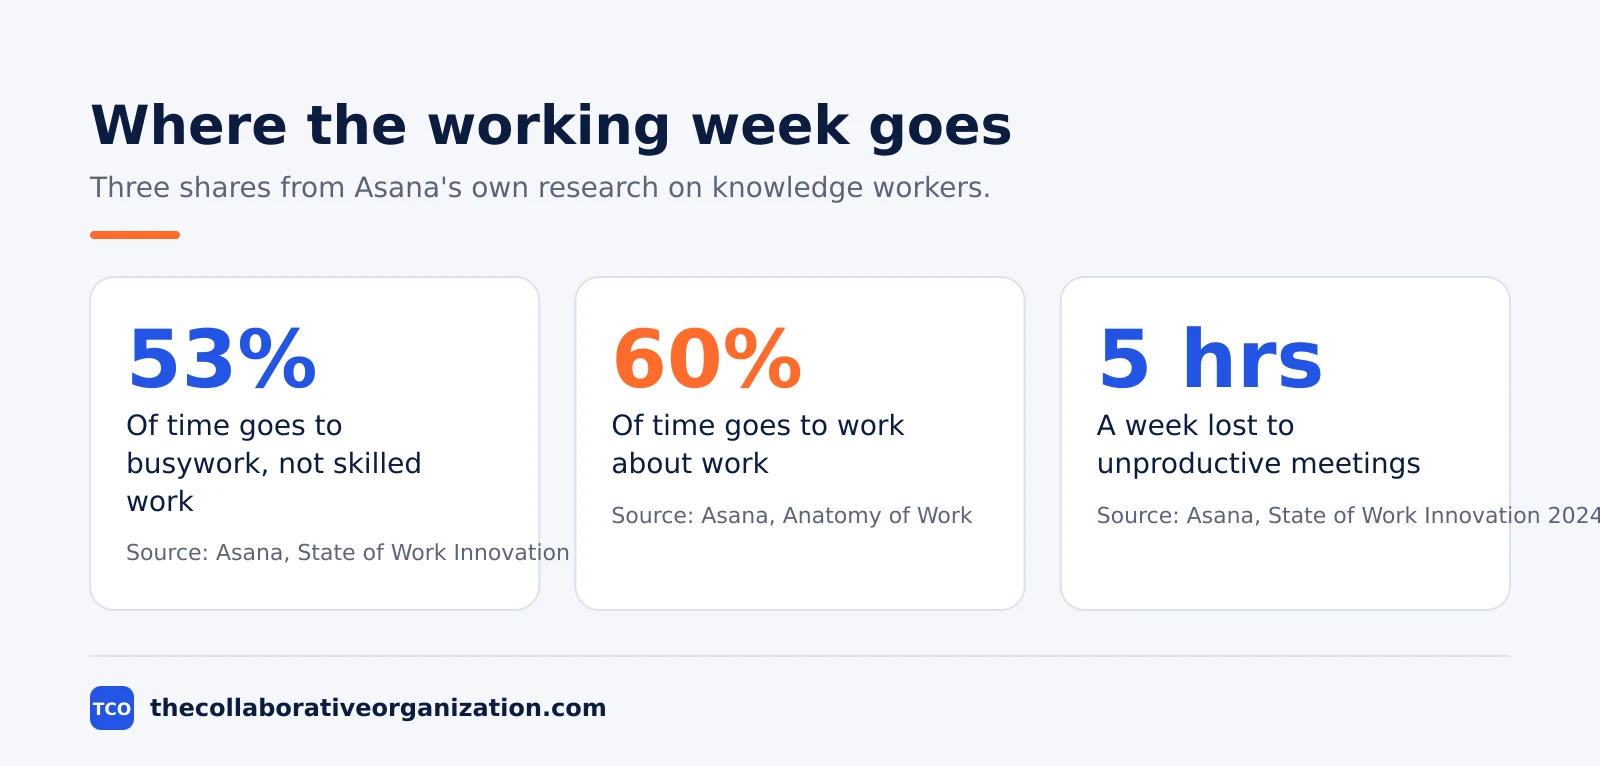
Busywork takes 53% of knowledge workers’ time, according to Asana’s State of Work Innovation 2024. Chasing the status of work, searching for information, and communicating about work leave only 47% for the skilled work people were hired to do.
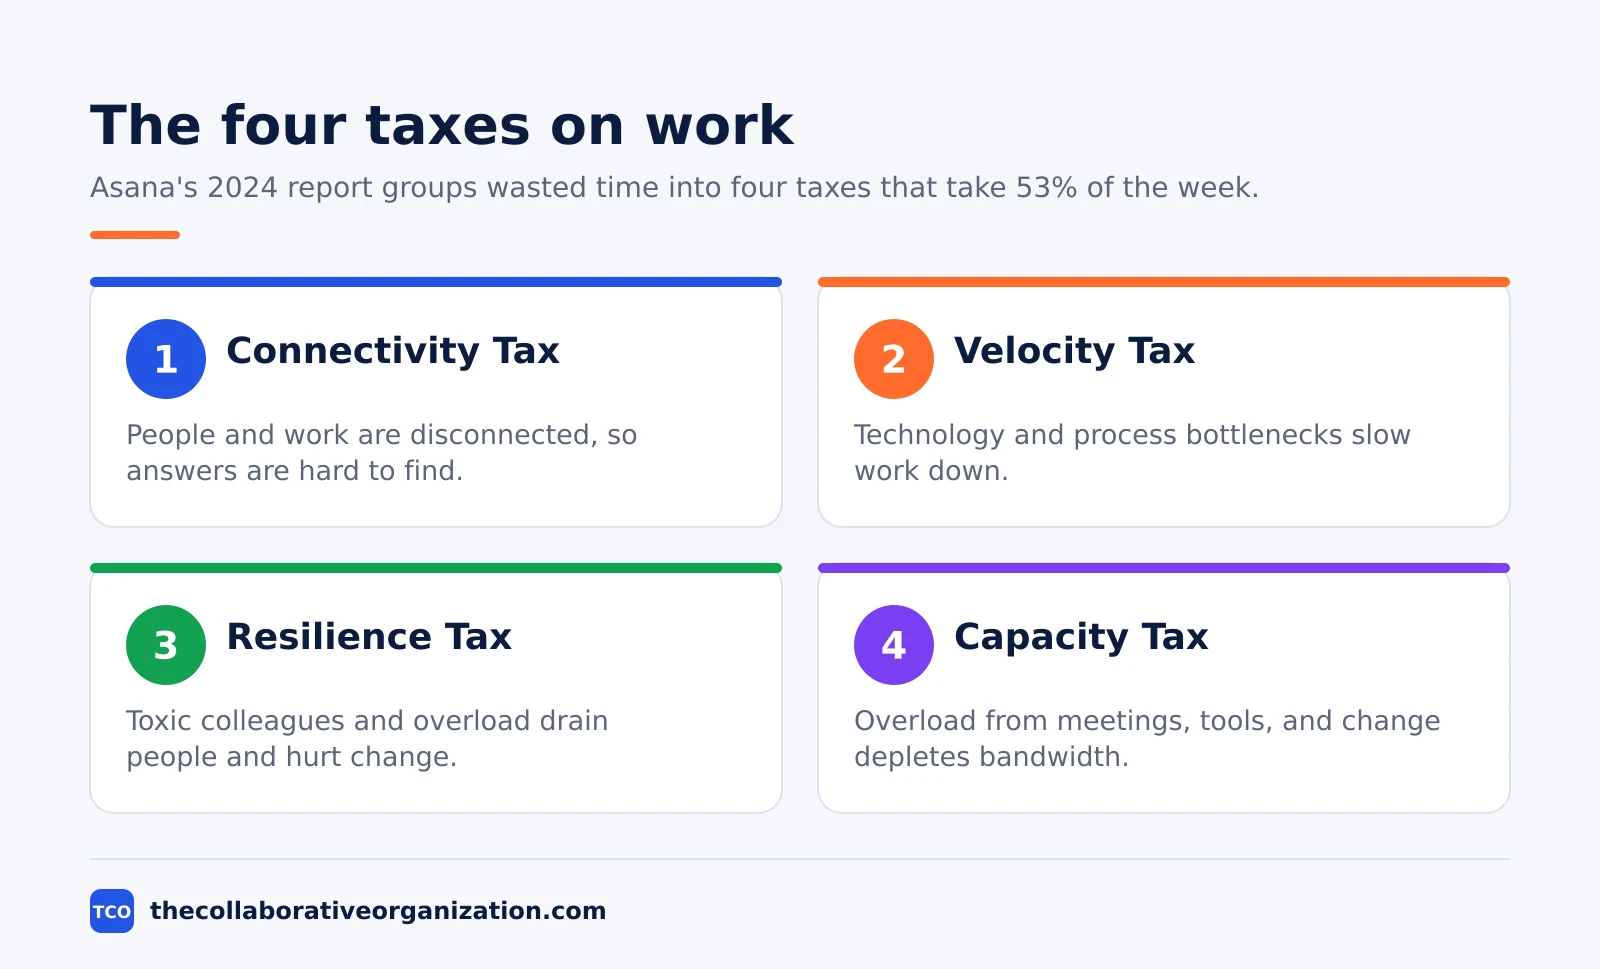
Asana groups the waste into four taxes: the Connectivity Tax of disconnected people and work, the Velocity Tax of bottlenecks, the Resilience Tax of overload and poor change, and the Capacity Tax of meeting and technology overload. Together they take 53% of the week, the State of Work Innovation report states.
The Anatomy of Work research tells a similar story with a different measure. Knowledge workers spend 60% of their time on “work about work”, Asana’s research page reports, based on a survey of more than 10,000 knowledge workers. That covers chasing updates, switching between apps, and sitting in status meetings.
The hours add up fast. The average knowledge worker spends 103 hours a year in unnecessary meetings, 209 hours a year on duplicative work, and 352 hours a year talking about work, the same Asana research found. Together that is 664 hours a year, or about 16 working weeks.
The load shows up in missed work. In Asana’s research, 88% of knowledge workers agreed that time-sensitive projects and large initiatives have fallen behind because of the volume of tasks on their plate, according to the same Asana page. Only 43% said they were clear on their organization’s objectives for the year.
Clarity is scarce. Just 46% of workers said they were clear on how their work adds value to the company, Asana’s research found. When people cannot see how their work connects to the goal, coordination fills the gap.
Joint work is now the norm. In Asana’s 2024 survey, 81% of workers said they spend some of their time collaborating with other teams, and 38% of their collaboration time is spent with other teams. Only 21% said their teams collaborate very effectively across the organization.
The failure rate is high. In the same Asana 2024 survey, 63% of workers said at least one cross-functional project they were part of failed to meet its goals last year. When the formal systems fail, 90% of workers rely on informal networks, friends, and unspoken understandings to get things done.
Exhaustion follows the load. In Asana’s 2024 survey, 75% of workers reported digital exhaustion, up from 64% a year earlier, according to the State of Work Innovation report. An earlier Asana study of 6,000 knowledge workers in Australia, the US, and the UK found 80% felt close to burnout.
Our project management statistics guide puts these figures next to the wider research on how projects fail and what teams do about it.
Meetings and the cost of coordination
Meetings take the largest single share of the coordination tax, and workers say most of them could be shorter. The figures below come from Asana, Atlassian, Microsoft, and Slack, and they agree with each other.
Unproductive meetings take 5 hours a week per knowledge worker, Asana’s 2024 survey found, double the figure from August 2019. Five hours a week is more than six working weeks a year spent in meetings that add no value.
People dread the load. In the same Asana 2024 survey, 44% of workers said they dread meetings. Only 13% of knowledge workers stick to a traditional 9-to-5 workday, while 59% work in a hybrid setup or have the option. Only 12% were fully remote by August 2024, down from 31% in March 2023.
Atlassian’s survey puts a number on meeting quality. Meetings are ineffective 72% of the time, Atlassian found in March 2024 in a survey of 5,000 knowledge workers. In the same survey, 78% said they are expected to attend so many meetings it is hard to get their work done.
Messages fill the gaps between meetings. In Microsoft 365, users spend 60% of their time on email, chat, and meetings, and 40% in creation apps, Microsoft and LinkedIn’s 2024 Work Trend Index found. The average worker receives 117 emails a day and 153 Teams messages per weekday, according to Microsoft’s 2025 telemetry.
Finding things eats the rest. Teams spend 25% of the workweek searching for information, Atlassian’s State of Teams 2025 found in a survey of 12,000 knowledge workers and 200 Fortune 1000 executives. Desk workers report spending 41% of their time on low-value, repetitive tasks, Slack’s Workforce Lab found in 2024.
The pattern is old. The McKinsey Global Institute estimated in 2012 that interaction workers spend about 28% of the workweek on email, in its report on social technologies. Twelve years later, the 2024 and 2025 figures above show the same split. Our workplace collaboration statistics guide tracks how the same load shows up across tools.
What Asana costs and what you get
Asana’s paid plans start at $10.99 per user per month, and the free plan covers 2 users. Prices below are from Asana’s own pricing page, checked on 19 November 2026.
Asana lists three paid tiers above its free Personal plan. Starter costs $10.99 per user per month when billed annually, or $13.49 when billed monthly, as of November 2026. Advanced costs $24.99 per user per month when billed annually, or $30.49 monthly. Enterprise pricing is by quote only.
The free Personal plan covers 2 users with unlimited tasks and projects, list, board, and calendar views, and more than 100 free integrations, according to Asana’s pricing page. Starter adds Timeline and Gantt views, reporting dashboards, and unlimited automations.
AI is now bundled into every paid plan. Starter includes 50,000 AI Studio credits per billing account per month, and Advanced includes 75,000, the same pricing page states. Enterprise includes 200,000 credits a month. Starter also includes 5 AI Teammate requests per user per month, up to 50 per account.
| Plan | Price (as of November 2026) | Best for |
|---|---|---|
| Personal | $0, free for 2 users | One or two people managing personal projects |
| Starter | $10.99 per user per month, billed annually | Small teams that need timelines and dashboards |
| Advanced | $24.99 per user per month, billed annually | Growing teams that need goals and resource management |
| Enterprise | Custom quote | Organizations that need SAML, SCIM, and audit controls |
Before you pick a plan, read our guide on how to choose project management software, which covers seat counts and free-plan caps.
If you are comparing Asana with its closest rival, our Asana vs Trello comparison lays out the differences side by side.
Our collaboration statistics guide shows how Asana’s busywork figures compare with the wider research.
Common Asana statistics mistakes to avoid
Most bad Asana numbers come from mixing two different surveys, or from reading a fiscal year as a calendar year. Run through the list below before you quote a figure.
- Mixing the 53% and the 60%. The 53% busywork figure comes from the State of Work Innovation 2024 survey, while the 60% “work about work” figure comes from Anatomy of Work research. They measure different things, so never add them or present one as the other.
- Quoting fiscal 2025 as 2025. Asana’s fiscal 2025 ended on 31 January 2025, so its $723.9 million revenue covers February 2024 to January 2025. Say fiscal 2025, not 2025.
- Using the monthly price as the annual price. Starter is $10.99 per user per month when billed annually and $13.49 when billed monthly. Quote the billing basis with the price.
- Treating the 80% burnout figure as 2024 data. It comes from an earlier Asana study of 6,000 knowledge workers in Australia, the US, and the UK, not from the 2024 survey of 13,066.
- Reading the 96% retention rate as growth. A dollar-based net retention rate of 96% means existing customers spent 4% less in total than the year before, not 4% more.
The full statistics table
The table below lists 30 statistics from the reports above, grouped by theme, with the source and the year for each one. Use it to check a figure before you quote it. Every number in the table also appears in the text above with a link to its original source.
| Statistic | Source | Year |
|---|---|---|
| $723.9M revenue in fiscal 2025, up 11% | Asana FY2025 results | 2025 |
| $188.3M revenue in Q4 fiscal 2025, up 10% | Asana FY2025 results | 2025 |
| 24,062 Core customers, up 11% | Asana FY2025 results | 2025 |
| 726 customers spending $100,000+, up 20% | Asana FY2025 results | 2025 |
| 96% dollar-based net retention rate | Asana FY2025 results | 2025 |
| 97% net retention rate for Core customers | Asana FY2025 results | 2025 |
| 169,000+ customers in total | Asana FY2025 results | 2025 |
| First full year of positive free cash flow | Asana FY2025 results | 2025 |
| 53% of time goes to busywork | Asana State of Work Innovation | 2024 |
| 47% of time left for skilled and strategic work | Asana State of Work Innovation | 2024 |
| 60% of time spent on work about work | Asana Anatomy of Work | 2026 |
| 103 hours a year in unnecessary meetings | Asana Anatomy of Work | 2026 |
| 209 hours a year on duplicative work | Asana Anatomy of Work | 2026 |
| 352 hours a year talking about work | Asana Anatomy of Work | 2026 |
| 88% say projects fell behind from task volume | Asana Anatomy of Work | 2026 |
| 43% clear on their organization’s objectives | Asana Anatomy of Work | 2026 |
| 46% clear on how their work adds value | Asana Anatomy of Work | 2026 |
| 12% fully remote in August 2024, down from 31% in 2023 | Asana State of Work Innovation | 2024 |
| 81% spend some time collaborating with other teams | Asana State of Work Innovation | 2024 |
| 38% of collaboration time is with other teams | Asana State of Work Innovation | 2024 |
| 21% say teams collaborate very effectively | Asana State of Work Innovation | 2024 |
| 63% had a cross-functional project miss its goals | Asana State of Work Innovation | 2024 |
| 90% rely on informal networks to get things done | Asana State of Work Innovation | 2024 |
| 75% report digital exhaustion, up from 64% | Asana State of Work Innovation | 2024 |
| 44% of workers dread meetings | Asana State of Work Innovation | 2024 |
| 5 hours a week lost to unproductive meetings | Asana State of Work Innovation | 2024 |
| 13% stick to a traditional 9-to-5 workday | Asana State of Work Innovation | 2024 |
| 59% work in a hybrid setup or have the option | Asana State of Work Innovation | 2024 |
| Starter $10.99 per user per month, billed annually | Asana pricing | 2026 |
| Advanced $24.99 per user per month, billed annually | Asana pricing | 2026 |
What the numbers mean
The numbers point at one problem: coordination eats the week, and Asana sells the fix while suffering the same problem as its customers. Its own research says workers lose more than half their time to busywork, and its own revenue growth comes from teams buying tools to cut that load.
The company numbers and the research numbers pull in opposite directions. Revenue grew 11% and large customers grew 20%, which says demand for work management is rising. The share of time lost to busywork has not fallen: 53% in 2024, against 60% on the Anatomy of Work measure. Buying a tool has not yet removed that tax.
Use the numbers to pick one fix, not ten. If searching eats a quarter of the week, fix the source of truth first. If meetings eat the day, cut the recurring ones and write decisions down. Compare the options on our project management software shortlist before you buy a tool to fix a habit problem.
A worked example shows what the numbers mean for one team. Picture a 50-person team where each person loses 5 hours a week to unproductive meetings, Asana’s 2024 figure. That is 250 hours a week, or more than 6 full-time roles spent in meetings that add no value.
Cutting those meetings in half would return about 3 roles’ worth of time to skilled work. The same team loses 53% of its week to busywork, which is 1,060 hours a week across 50 people. The numbers in this example are an illustration, built from Asana’s 2024 figures of 5 hours a week and 53% busywork.
Sources
- Asana - The State of Work Innovation 2024 (2024)
- Asana - How Work About Work Gets in the Way of Real Work (2026)
- Asana - Fourth Quarter and Fiscal Year 2025 Results (2025)
- Asana - Pricing (2026)
- Microsoft and LinkedIn - AI at Work Is Here. Now Comes the Hard Part (2024)
- Microsoft - Breaking Down the Infinite Workday (2025)
- Atlassian - State of Teams 2025 (2025)
- Atlassian - Workplace Woes: Meetings Edition (2024)
- Slack - New Slack Research Shows Accelerating AI Use at Work (2024)
- McKinsey Global Institute - The Social Economy (2012)
Frequently asked questions
How much time do knowledge workers spend on busywork according to Asana?
Asana's State of Work Innovation 2024 found that 53% of knowledge workers' time goes to busywork, which leaves only 47% for skilled and strategic work. Busywork here means chasing the status of work, searching for information, and communicating about work. The survey covered 13,066 knowledge workers in six countries.
How many customers does Asana have?
Asana reported more than 169,000 customers in its fiscal 2025 results, published in March 2025. Of those, 24,062 were Core customers spending at least $5,000 a year, up 11% year over year. Another 726 customers spent $100,000 or more a year, up 20% year over year.
What is Asana's revenue?
Asana's revenue for fiscal 2025, which ended on 31 January 2025, was $723.9 million, up 11% year over year. Fourth-quarter revenue was $188.3 million, up 10% year over year. The company also reported its first full year of positive free cash flow in fiscal 2025.
How much does Asana cost?
Asana's Personal plan is free for up to 2 users. Starter costs $10.99 per user per month when billed annually, or $13.49 when billed monthly, as of November 2026. Advanced costs $24.99 per user per month when billed annually, or $30.49 monthly. Enterprise pricing is by quote.
What does Asana mean by work about work?
Work about work is the coordination around the real work: chasing updates, searching for information, switching between apps, managing shifting priorities, and checking the status of work. Asana's Anatomy of Work research found knowledge workers spend 60% of their time on it, and only 40% on the skilled work they were hired to do.
Related articles

guides
Free Project Management Templates: 7 to Copy (2026)
Seven free project management templates from monday, Wrike, Teamwork, Smartsheet, ClickUp, Asana and Trello, with what each one is for and what free really costs.
November 20, 2026 · 7 min read

guides
Project Proposal Template: Copy and Win Work (2026)
A project proposal template pitches the work before it is approved: problem, solution, scope, budget, timeline and terms. Copy the template and filled example.
November 20, 2026 · 10 min read

guides
Action Plan Template: Goal to Done in One Page (2026)
An action plan template turns one goal into owned steps with dates, dependencies and a success measure. Copy the table and see it filled for a support team.
November 20, 2026 · 11 min read