Workplace Collaboration Statistics: 25+ Stats (2026) | The Collaborative Organization
By The Collaborative Organization Team · November 19, 2026 · Last verified November 19, 2026 · 14 min read
Workplace collaboration statistics show a clear pattern: people spend most of their week talking about work, searching for it, or sitting in meetings about it. The numbers below come from the original reports, not from roundups. Each figure names its source and its year, so you can check it yourself.
Key takeaways
- Microsoft’s 2025 telemetry: the average worker gets 117 emails and 153 Teams messages a day.
- In Microsoft 365, 60% of time goes to email, chat, and meetings, and only 40% to creating work, based on 2024 data.
- Gallup’s 2024 meta-analysis ties top-quartile engagement to 23% higher profitability and 18% higher sales productivity.
- Atlassian’s 2025 survey: teams spend 25% of the workweek searching for information.
- Zoom’s 2024 survey puts bad collaboration at up to $16,491 a year per manager.
How we chose these stats
We took every number in this article from the publisher’s own report, press release, or dataset, or from a peer-reviewed paper, and we checked each one against that source on 19 November 2026. We used the latest edition of each yearly report that includes the figure. Vendor surveys are flagged as vendor surveys, and modelled estimates are flagged as estimates.
We left out figures we could not trace to an original source, including the popular claim that teams are 50% more productive, which traces to a 2014 experiment that measured persistence, not productivity.
Where a publisher’s page had moved or blocked access, we dropped the figure instead of citing a roundup. Every stat in the table below names its source and the year its data was collected.
The sources are Microsoft’s Work Trend Index (2024 and 2025), Gallup (2024 and 2026), Asana’s State of Work Innovation (2024), Atlassian’s State of Teams (2025) and Workplace Woes (2024), Zoom and Morning Consult (2024), Slack’s Workforce Lab (2024), and McKinsey Global Institute (2012). Older studies are included only where no newer original exists for that finding.
Where the working week goes
Most of the working week goes to talking about work, not doing it. The four figures below come from four different publishers, and they all point the same way. Read them together before you quote any one of them alone.
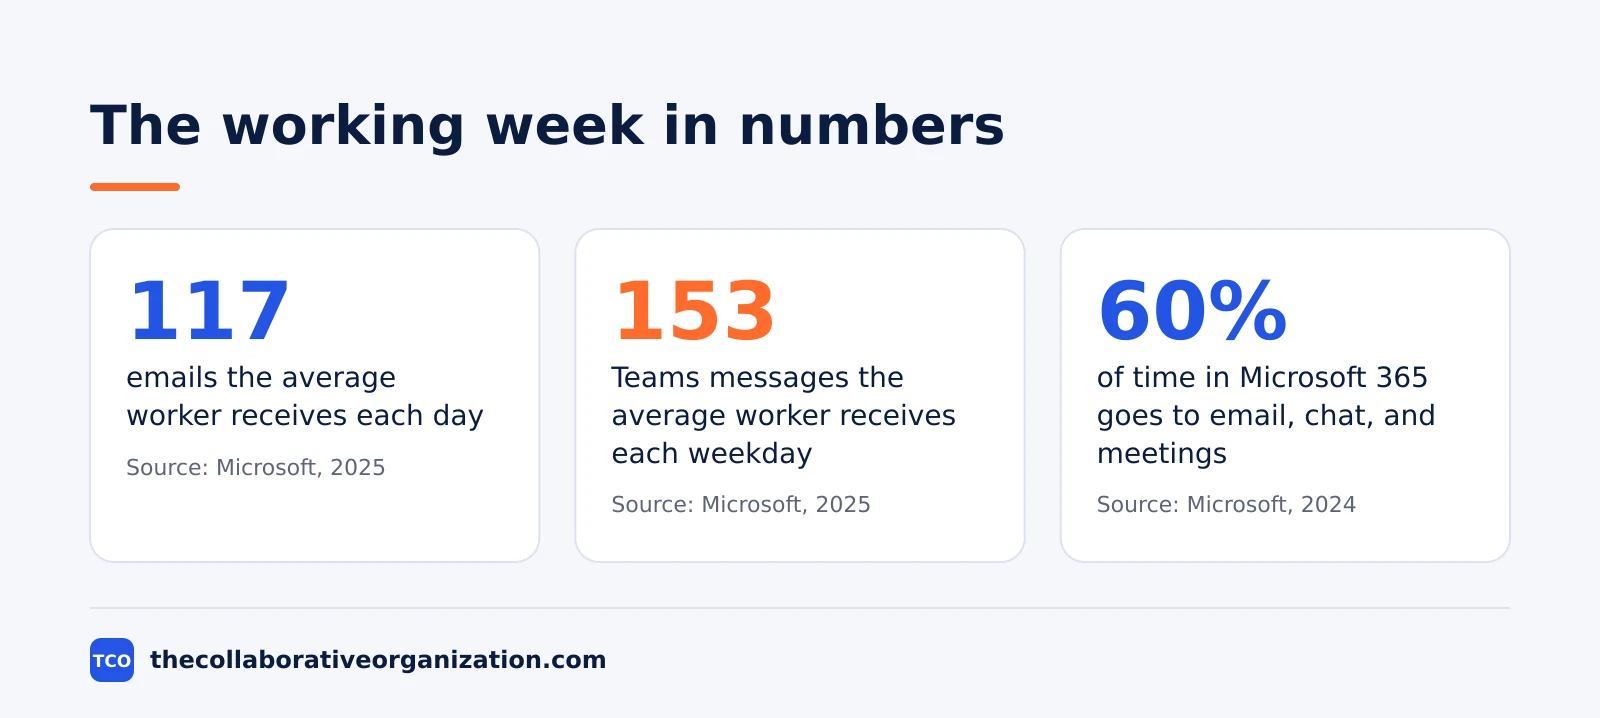
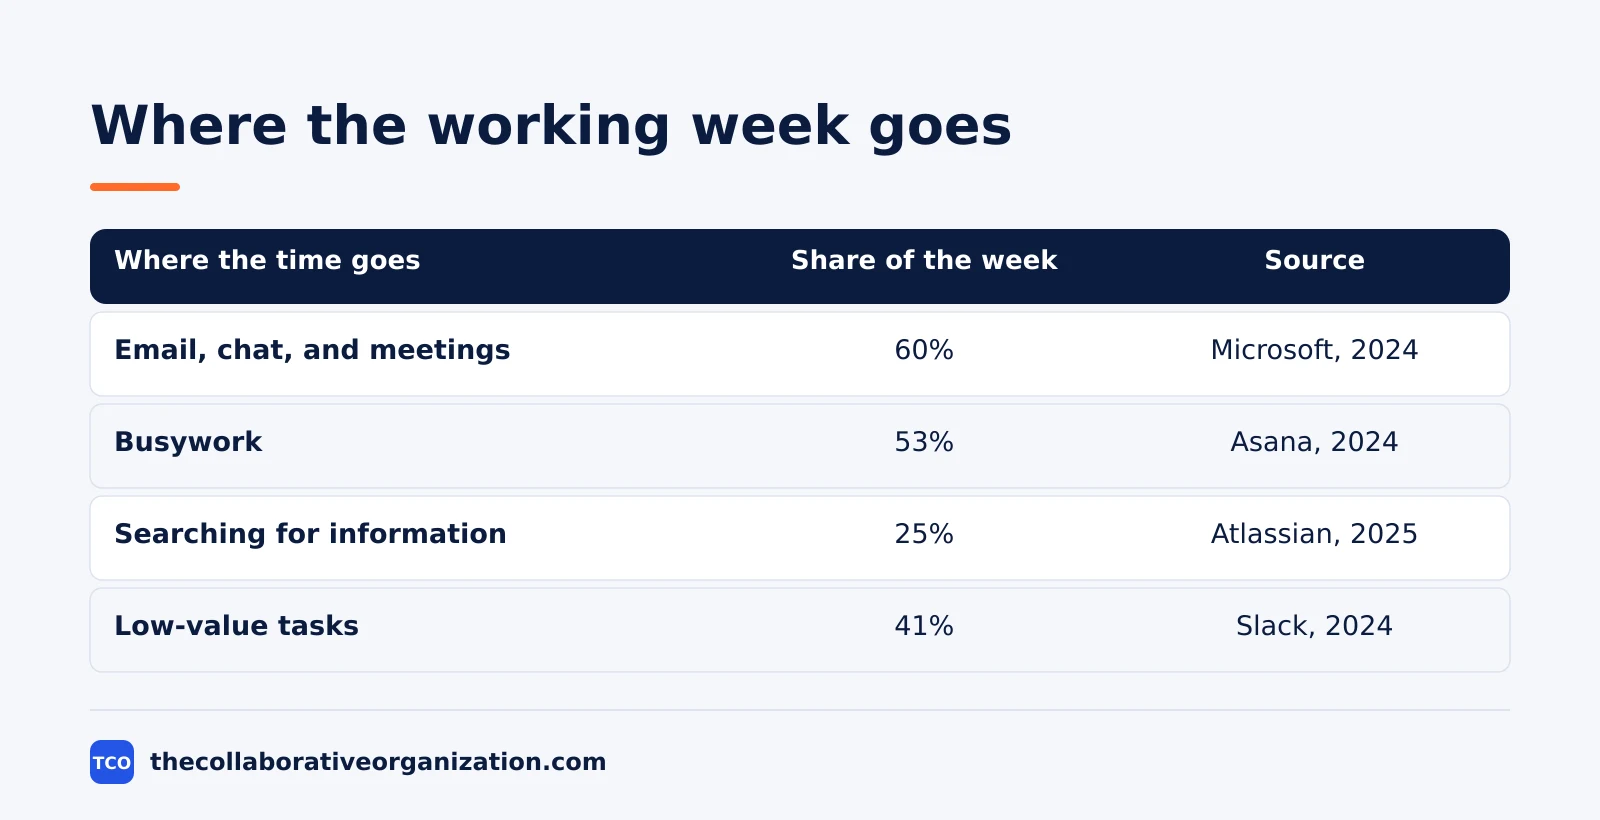
In Microsoft 365, users spend 60% of their time on email, chat, and meetings, and 40% in creation apps such as Word and PowerPoint. The figure comes from Microsoft and LinkedIn’s 2024 Work Trend Index, which measured app telemetry for the 28 days to March 2024. It covers time inside Microsoft 365, not the whole workday.
Busywork takes 53% of knowledge workers’ time, according to Asana’s State of Work Innovation 2024, a survey of 13,066 knowledge workers in six countries. Chasing the status of work, searching for information, and communicating about work leave only 47% for skilled and strategic work.
Teams spend 25% of the workweek searching for information, Atlassian’s State of Teams 2025 found in a survey of 12,000 knowledge workers and 200 Fortune 1000 executives. Difficulty finding information was the top barrier to moving fast in the same survey.
Desk workers report spending 41% of their time on low-value, repetitive tasks, Slack’s Workforce Lab found in 2024 in a survey of 10,281 desk workers. Chat in Slack is where much of that low-value work shows up as messages that could have been a written update.
The message load behind those shares is large. Microsoft’s 2025 telemetry shows the average worker receives 117 emails a day and 153 Teams messages per weekday, most emails skimmed in under 60 seconds. The data runs to 15 February 2025.
The pattern is old. The McKinsey Global Institute estimated in 2012 that interaction workers spend about 28% of the workweek on email and nearly 20% looking for internal information or tracking down colleagues, in its report on social technologies. Twelve years later, the 2024 and 2025 figures above show the same split.
What poor collaboration costs
Poor collaboration costs money in three ways: managers’ time, lost projects, and lost engagement. The figures below put a number on each one. Treat the modelled figures as estimates, not as measured losses.
Over one-third of leaders spend an hour or more a day resolving four bad-collaboration issues, Zoom and Morning Consult found in 2024 in a survey of 7,969 knowledge workers in 16 countries. One hour on any of these issues could cost up to an estimated $16,491 a year per manager.
For an enterprise of 1,000 people, that cost adds up to more than $874,000 a year, the same Zoom 2024 report estimates. The figure assumes one-third of managers lose an hour a day, and it uses average management salaries from the US Bureau of Labor Statistics.
Unproductive meetings take 5 hours a week per knowledge worker, Asana’s 2024 survey found, double the figure from August 2019. Five hours a week is more than six working weeks a year spent in meetings that add no value.
Joint projects fail often. In the same Asana 2024 survey, 63% of workers said at least one cross-functional project they were part of failed to meet its goals last year. Only 21% said their teams collaborate very effectively across the organization.
Finding answers costs meetings. In Atlassian’s 2025 survey, 56% of knowledge workers said they often have to ask someone or book a meeting to get the information they need. When the answer is not written down, the only route to it is another person’s time.
Low engagement cost the world economy about $10 trillion in lost productivity in 2025, or 9% of GDP, Gallup estimated in its State of the Global Workplace 2026. The figure is a model built from Gallup’s engagement data, not a measured loss, so read it as the scale of the problem.
Engagement and performance
Engaged teams do better on every business outcome Gallup measures, from sales to safety. The figures below compare top-quartile and bottom-quartile engagement units. They show an association, not proof that engagement caused the gap.
Only 20% of employees worldwide were engaged at work in 2025, Gallup’s 2026 report found, down from a peak of 23% in 2022. The survey covered 263,810 people in more than 160 countries.
Manager engagement fell to 22% in 2025, the same Gallup 2026 report found, down from 27% in 2024. In best-practice organizations, 79% of managers were engaged, nearly four times the global average.
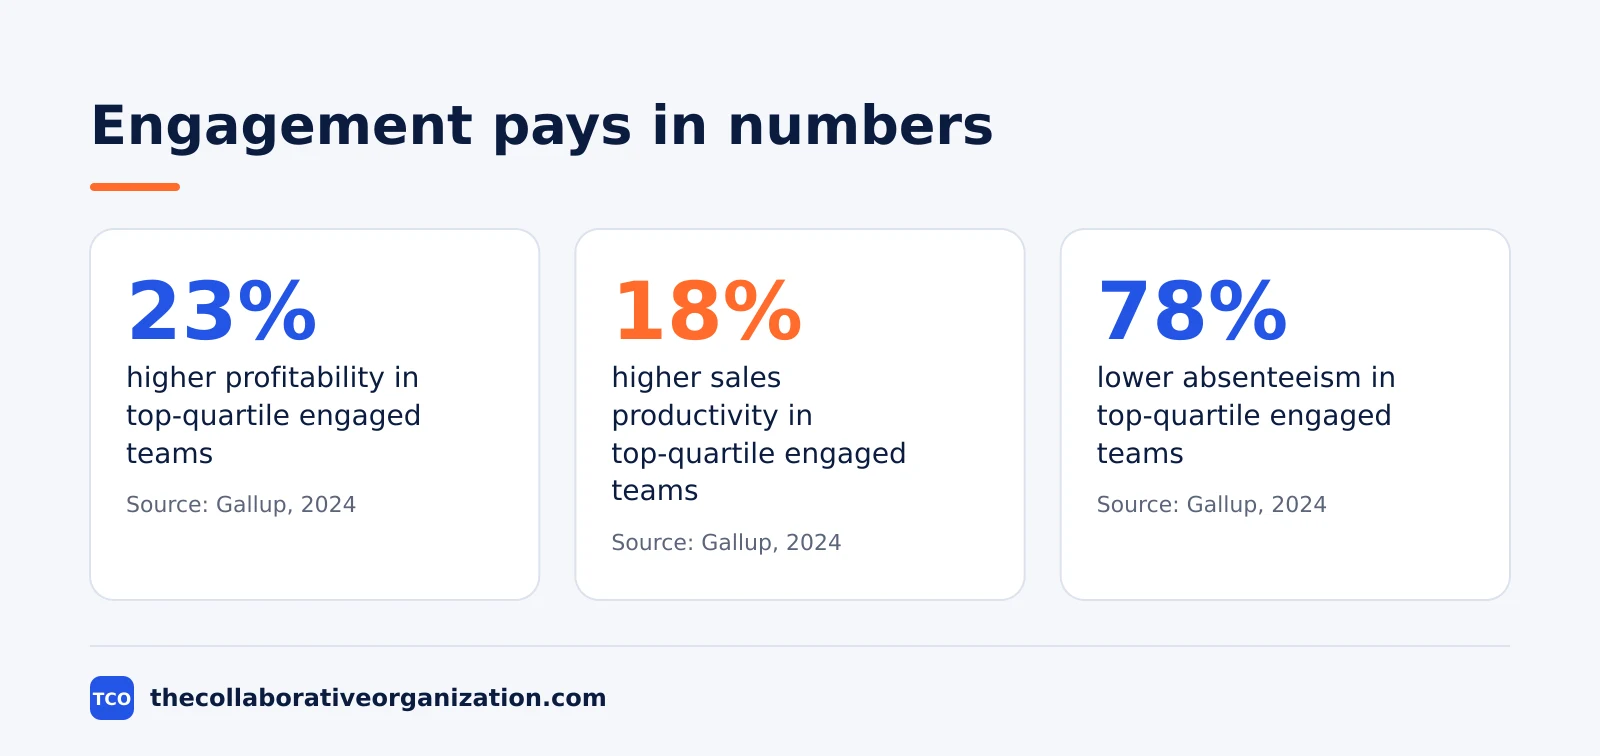
Teams in the top quartile for engagement had 18% higher sales productivity and 23% higher profitability than bottom-quartile teams, Gallup’s 2024 Q12 meta-analysis found across 183,806 business units. Production productivity was 14% higher in the same comparison.
The same Gallup 2024 meta-analysis found top-quartile teams had 78% lower absenteeism, 51% lower turnover in low-turnover organizations, and 32% fewer quality defects. The analysis pooled 736 studies covering 3.35 million employees in 90 countries.
Better tools could add to the gain. The McKinsey Global Institute estimated in 2012 that social technologies could raise the productivity of interaction workers by 20 to 25 percent, in its report on social technologies. The figure is a modelled estimate of what full adoption could bring, not a measured result.
Teams that track adoption often start with agile adoption statistics to set a baseline.
Meetings, messages, and interruptions
Meetings and messages split the day into pieces too small for deep work. The figures below come from Microsoft telemetry and Atlassian surveys, and they agree: the working day is full of other people’s priorities.
Heavy Microsoft 365 users are interrupted every 2 minutes on average during core work hours, Microsoft’s 2025 telemetry shows. The figure covers the top 20% of users by ping volume, who receive about 275 pings a day.
Nearly half of employees (48%) and more than half of leaders (52%) say their work feels chaotic and fragmented, the same Microsoft 2025 survey found among 31,000 knowledge workers. One in three said the pace of work over the past five years makes it impossible to keep up.
Meetings are ineffective 72% of the time, and 78% of workers say they are expected to attend so many meetings it is hard to get their work done, Atlassian found in March 2024 in a survey of 5,000 knowledge workers. The same survey found 51% work overtime at least a few days a week because of meeting overload.
Workers see the waste clearly. In the same Atlassian 2024 survey, 80% said most of their meetings could be done in half the time, and 79% said an agenda leads to more productive meetings. Yet 62% often attend meetings that did not state a goal in the invite.
Most meetings are not even planned. In Microsoft’s 2025 telemetry, 57% of meetings are ad hoc calls without a calendar invite, and 1 in 10 scheduled meetings is booked at the last minute. A short daily check-in, like the standup in Scrum, replaces many of these calls with one fixed slot.
Meetings also pile into the best hours and the late hours. In the same Microsoft 2025 report, 50% of meetings fall between 9 and 11 am and 1 and 3 pm, 30% span multiple time zones, and meetings after 8 pm are up 16% year over year.
Hybrid work and AI
Hybrid work and AI changed how teams meet, but they did not fix the load. The figures below show adoption rising while training and time lag behind.
Three in four knowledge workers use AI at work: 75%, Microsoft and LinkedIn found in their 2024 Work Trend Index. Almost half of those users started less than six months before the survey, and 78% bring their own AI tools to work.
Training lags far behind use. Only 39% of people who use AI at work have received AI training from their company, the same Microsoft 2024 report found, and only 25% of companies planned to offer generative AI training that year. Our AI productivity statistics guide tracks how that gap shows up in output.
The load behind the AI rush is heavy. In the same Microsoft 2024 survey, 68% of people said they struggle with the pace and volume of work, and 46% felt burned out. Nine in ten AI users said AI helps them save time.
Joint work is now the norm, not the exception. In Asana’s 2024 survey, 81% of workers said they spend some of their time collaborating with other teams, and 59% work in a hybrid setup or have the option. Adoption of the tools that support that work is tracked in our software adoption statistics guide.
People dread the meeting load that comes with it. In the same Asana 2024 survey, 44% of workers said they dread meetings, and 75% reported digital exhaustion, up from 64% a year earlier.
The full statistics table
The table below lists 40 statistics from the reports above, grouped by theme, with the source and the year for each one. Use it to check a figure before you quote it. Every number in the table also appears in the text above with a link to its original source.
| Statistic | Source | Year |
|---|---|---|
| 60% of time in Microsoft 365 on email, chat, and meetings | Microsoft Work Trend Index | 2024 |
| 117 emails received per day on average | Microsoft Work Trend Index | 2025 |
| 153 Teams messages received per weekday | Microsoft Work Trend Index | 2025 |
| 53% of knowledge workers’ time goes to busywork | Asana State of Work Innovation | 2024 |
| 25% of the workweek spent searching for information | Atlassian State of Teams | 2025 |
| 41% of time spent on low-value, repetitive tasks | Slack Workforce Lab | 2024 |
| 28% of the workweek spent on email | McKinsey Global Institute | 2012 |
| About 20% spent looking for information or colleagues | McKinsey Global Institute | 2012 |
| $16,491 a year per manager lost to bad collaboration | Zoom and Morning Consult | 2024 |
| $874,000+ a year lost per 1,000-person enterprise | Zoom and Morning Consult | 2024 |
| $10 trillion lost productivity from low engagement | Gallup State of the Global Workplace | 2026 |
| 5 hours a week lost to unproductive meetings | Asana State of Work Innovation | 2024 |
| 63% had a cross-functional project miss its goals | Asana State of Work Innovation | 2024 |
| 56% often ask someone or book a meeting for information | Atlassian State of Teams | 2025 |
| 20% of employees worldwide engaged at work | Gallup State of the Global Workplace | 2026 |
| 22% of managers engaged at work | Gallup State of the Global Workplace | 2026 |
| 79% of managers engaged in best-practice organizations | Gallup State of the Global Workplace | 2026 |
| 18% higher sales productivity in top-quartile teams | Gallup Q12 Meta-Analysis | 2024 |
| 23% higher profitability in top-quartile teams | Gallup Q12 Meta-Analysis | 2024 |
| 78% lower absenteeism in top-quartile teams | Gallup Q12 Meta-Analysis | 2024 |
| 51% lower turnover in low-turnover organizations | Gallup Q12 Meta-Analysis | 2024 |
| 32% fewer quality defects in top-quartile teams | Gallup Q12 Meta-Analysis | 2024 |
| 20-25% productivity gain from social tech (modelled) | McKinsey Global Institute | 2012 |
| Interrupted every 2 minutes (heaviest users) | Microsoft Work Trend Index | 2025 |
| 48% of employees say work feels chaotic and fragmented | Microsoft Work Trend Index | 2025 |
| 78% say too many meetings make work hard | Atlassian Workplace Woes | 2024 |
| 51% work overtime due to meeting overload | Atlassian Workplace Woes | 2024 |
| 80% say most meetings could take half the time | Atlassian Workplace Woes | 2024 |
| 57% of meetings are ad hoc, with no invite | Microsoft Work Trend Index | 2025 |
| 30% of meetings span multiple time zones | Microsoft Work Trend Index | 2025 |
| 75% of knowledge workers use AI at work | Microsoft Work Trend Index | 2024 |
| 78% of AI users bring their own AI tools | Microsoft Work Trend Index | 2024 |
| 68% struggle with the pace and volume of work | Microsoft Work Trend Index | 2024 |
| 46% of knowledge workers feel burned out | Microsoft Work Trend Index | 2024 |
| 39% of AI users received AI training from work | Microsoft Work Trend Index | 2024 |
| 50% of meetings fall in peak hours (9-11 am, 1-3 pm) | Microsoft Work Trend Index | 2025 |
| Meetings after 8 pm up 16% year over year | Microsoft Work Trend Index | 2025 |
| 81% of workers collaborate with other teams | Asana State of Work Innovation | 2024 |
| 21% say teams collaborate very effectively | Asana State of Work Innovation | 2024 |
| 44% of workers dread meetings | Asana State of Work Innovation | 2024 |
What the numbers mean
The numbers point at one problem: the gap between the person who knows something and the person who needs it. People search for it, ask for it, or book a meeting to get it. Three habits help: write the answer down once, send a short update instead of a status meeting, and show work instead of describing it.
Three popular numbers do not hold up, so do not quote them. The claim that teams are 50% more productive comes from a 2014 experiment that measured persistence on a puzzle, not productivity. The claim that collaborative teams are 5 times more likely to be high-performing reverses the finding: high performers were more likely to reward collaboration.
The claim that good communication lifts customer satisfaction by 50% has no traceable source at all. When a number has no original report behind it, leave it out. A smaller set of checked numbers beats a long list of borrowed ones.
Use the numbers to pick one fix, not ten. If searching eats a quarter of the week, fix the source of truth first. If meetings eat the day, cut the recurring ones and write decisions down. Compare the options on our project management software shortlist before you buy a tool to fix a habit problem.
A worked example shows what the numbers mean for one team. Picture a 100-person team where each person loses 5 hours a week to unproductive meetings. That is 500 hours a week, or about 12 full-time roles spent in meetings that add no value.
Cutting those meetings in half would return about 6 roles’ worth of time to skilled work. The numbers in this example are an illustration, built from Asana’s 2024 figure of 5 hours a week.
Sources
- Microsoft - Breaking Down the Infinite Workday (2025)
- Microsoft and LinkedIn - AI at Work Is Here. Now Comes the Hard Part (2024)
- Gallup - State of the Global Workplace 2026 (2026)
- Gallup - Employee Engagement and Productivity (2024)
- Asana - The State of Work Innovation 2024 (2024)
- Atlassian - State of Teams 2025 (2025)
- Atlassian - Workplace Woes: Meetings Edition (2024)
- Zoom - Global Collaboration in the Workplace (2024)
- Slack - New Slack Research Shows Accelerating AI Use at Work (2024)
- McKinsey Global Institute - The Social Economy (2012)
Frequently asked questions
How much time do employees spend on meetings, email, and chat?
Microsoft's telemetry shows people spend 60% of their time in Microsoft 365 on email, chat, and meetings, based on 2024 data. The average worker also receives 117 emails and 153 Teams messages a day, according to Microsoft's 2025 report. Asana's 2024 survey adds that unproductive meetings alone take 5 hours a week.
How much does poor communication cost a business?
Zoom and Morning Consult estimated in 2024 that bad collaboration costs up to $16,491 a year per manager, or more than $874,000 a year for an enterprise of 1,000 people. Gallup estimated in 2026 that low engagement cost the world economy about $10 trillion in lost productivity in 2025. Both figures are estimates, not measured losses.
How many employees work hybrid or remotely?
Asana's 2024 survey of 13,066 knowledge workers found 59% work in a hybrid setup or have the option, while only 13% stick to a traditional 9-to-5 workday. Microsoft's 2025 telemetry found 30% of meetings span multiple time zones, which shows how common cross-location work has become.
What share of employees are engaged at work?
Gallup's State of the Global Workplace 2026 found 20% of employees worldwide were engaged in 2025, down from a peak of 23% in 2022. Manager engagement fell to 22% in the same year. In best-practice organizations, 79% of managers were engaged, nearly four times the global average.
Can I cite these statistics?
Yes. Cite the original source linked beside each number, with its date, so readers can check it. Every figure in this article comes from the publisher's own report or dataset, or from a peer-reviewed paper, and each one was checked against that source on 19 November 2026.
Related articles
project management
How to Choose Project Management Software (2026)
Pick project management software in seven steps: define the work, count seats, price the real cost, and run a two-week pilot before you pay.
November 19, 2026 · 10 min read
project management
What Is a RACI Matrix? Definition, Roles and Examples (2026)
A RACI matrix maps who is Responsible, Accountable, Consulted and Informed for each task. Learn the four roles, how to build one, and see a worked example.
November 19, 2026 · 9 min read
project management
Daily Standup Meeting Format That Works (2026)
A daily standup is a 15-minute meeting where Developers inspect progress toward the Sprint Goal and plan the next day. Use this format to run one that ends on time.
November 19, 2026 · 10 min read