30 Hybrid Work Statistics for 2026 | The Collaborative Organization
By The Collaborative Organization Team · November 19, 2026 · Last verified November 19, 2026 · 13 min read
This list brings together 30 hybrid work statistics from Gallup, Owl Labs, Cisco, Pew, McKinsey, FlexJobs, and Atlassian. Every figure names its source and year, and every number links to the original study in the body.
Key takeaways
- Hybrid is the most common arrangement for remote-capable workers: 51 percent in May 2025, and 52 percent as of 2026, according to Gallup.
- Hybrid workers spend 46 percent of their workweek in the office, about 2.3 days, and three days in the office is the most common pattern.
- Team-decided schedules work best: 91 percent of those workers see the policy as fair, the same rate as workers who decide it themselves.
- A randomized trial found two home days a week cut resignations by 33 percent with no effect on performance or promotions.
- 72 percent of organizations now have mandates for working in the office, according to Cisco in 2025.
How we chose these 30 statistics
We picked statistics from original studies and official data, and we kept only figures about hybrid work itself. A figure about all remote workers does not belong in a hybrid list, even when the same survey produced it. Each figure below comes from the organization that measured it, with its sample and year, and the table at the end lists all 30 with source and year.
Read the base with each number before you compare two figures. Gallup counts remote-capable workers, about half of the United States workforce, while Owl Labs counts all full-time workers, and Cisco counts workers across 21 markets worldwide. Their hybrid shares differ because their groups differ, not because one of them is wrong.
We dropped figures we could not trace to a published study, and we dropped figures whose only source was an aggregator page. The one exception is noted in the notes for this article: the Gallup preference figures rest on a summary, so they are not in this list.
How common is hybrid work
Hybrid work is the most common arrangement for people whose jobs can be done remotely, and it has held that place since 2022. The figures below come from three different bases, and they agree on the direction.
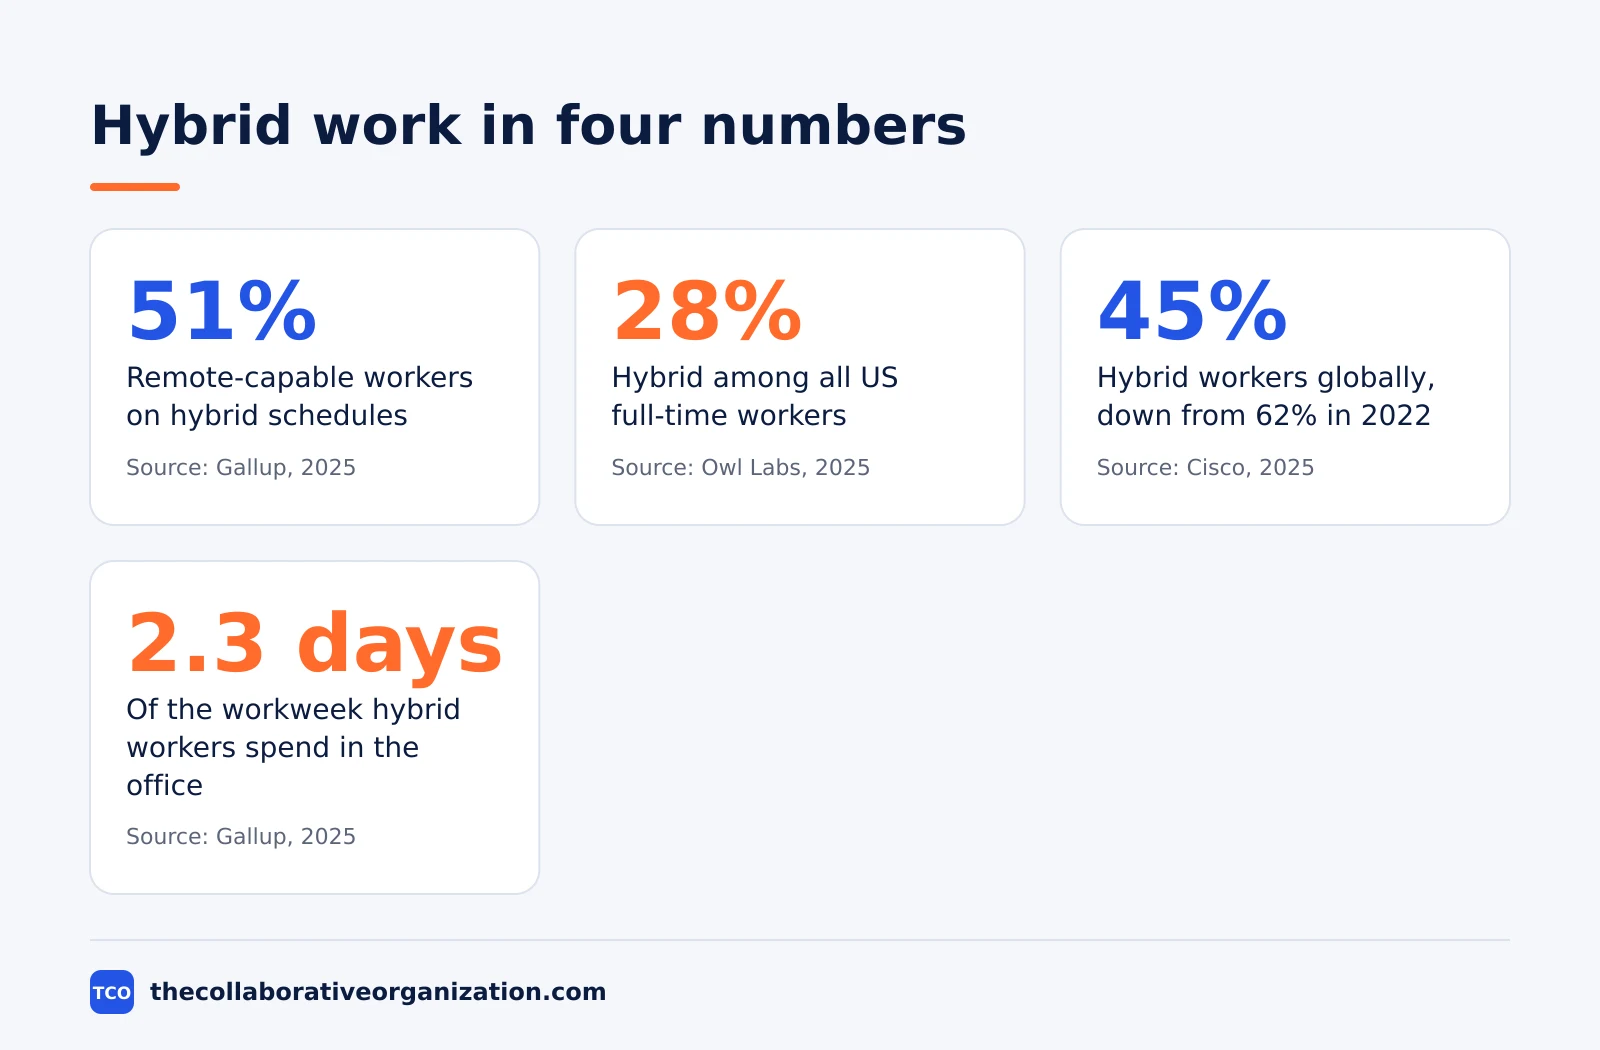
Gallup found 51 percent of remote-capable United States employees worked hybrid in May 2025, and 52 percent as of 2026, with 26 percent exclusively remote and 22 percent on-site. The split varies by industry: in tech, 47 percent are fully remote, 45 percent hybrid, and 9 percent on-site.
The federal government is the exception: hybrid fell from 61 percent in late 2024 to 28 percent in 2025, with 46 percent of federal workers now fully on-site, according to Gallup.
Owl Labs counts all full-time workers rather than remote-capable ones, so its hybrid share is lower: 28 percent hybrid, 9 percent fully remote, and 63 percent fully in-office in 2025, in a survey of 2,000 people, according to Owl Labs.
Globally, Cisco found 45 percent hybrid in 2025, down from 62 percent in 2022, with 49 percent fully on-site and 6 percent fully remote, in a survey of 21,513 employers and employees across 21 markets, according to Cisco.
Pew Research Center found 41 percent of remote-capable workers on a hybrid schedule in 2023, up from 35 percent in January 2022, according to Pew Research Center.
Hybrid office days
The typical hybrid week now has two or three office days, and the number is creeping up. The figures below show the pattern and the pressure behind it.
Hybrid workers spend 46 percent of their workweek in the office, about 2.3 days, up from 42 percent in 2022, according to Gallup. All of that rise happened in 2023, and nothing changed in the past year.
Owl Labs found 39 percent of hybrid workers go into the office three days a week, the most common pattern, and 34 percent go in four days, up from 32 percent in 2024 and 23 percent in 2023, according to Owl Labs.
Pew found 59 percent of hybrid workers work from home three or more days in a typical week, while 41 percent do so two days or fewer. 63 percent of hybrid workers who are not self-employed say their employer requires them to be in person a set number of days per week or month, according to Pew Research Center.
What workers want from hybrid work
Workers want hybrid work, but they want control over when they work even more than control over where they work. The preference figures below come from employee surveys, not from employers.
A quarter of employees would prefer to be in the office full time, and 21 percent would like to be there four days a week, up from 17 percent in 2024, according to Owl Labs. The same survey found workers feel most productive in the office when managing others, meeting new people, and collaborating.
FlexJobs found 40 percent of workers want hybrid, 58 percent want fully remote, and 2 percent want full-time office work, in its 2025 survey of more than 3,000 United States professionals, according to FlexJobs.
McKinsey found hybrid is the most favored option, particularly among office-based workers, in its American Opportunity Survey of summer 2024. About 50 percent of workers overall currently work sometimes remotely, and the preference for sometimes-remote work runs higher than the current share, according to McKinsey.
37 percent of employees would not accept a job offer from a company that does not allow flexible working hours, up from 35 percent in 2024, according to Owl Labs.
A four-day week is one of the most wanted benefits: 27 percent of workers say it would be appealing if a prospective employer offered it, and workers would sacrifice 9 percent of their salaries for flexible working hours and 8 percent for a four-day week, according to Owl Labs.
Who decides the hybrid schedule
Team-decided schedules beat both self-decided and employer-decided schedules on fairness and on burnout. The figures below are the most useful in this whole list for anyone writing a hybrid policy.
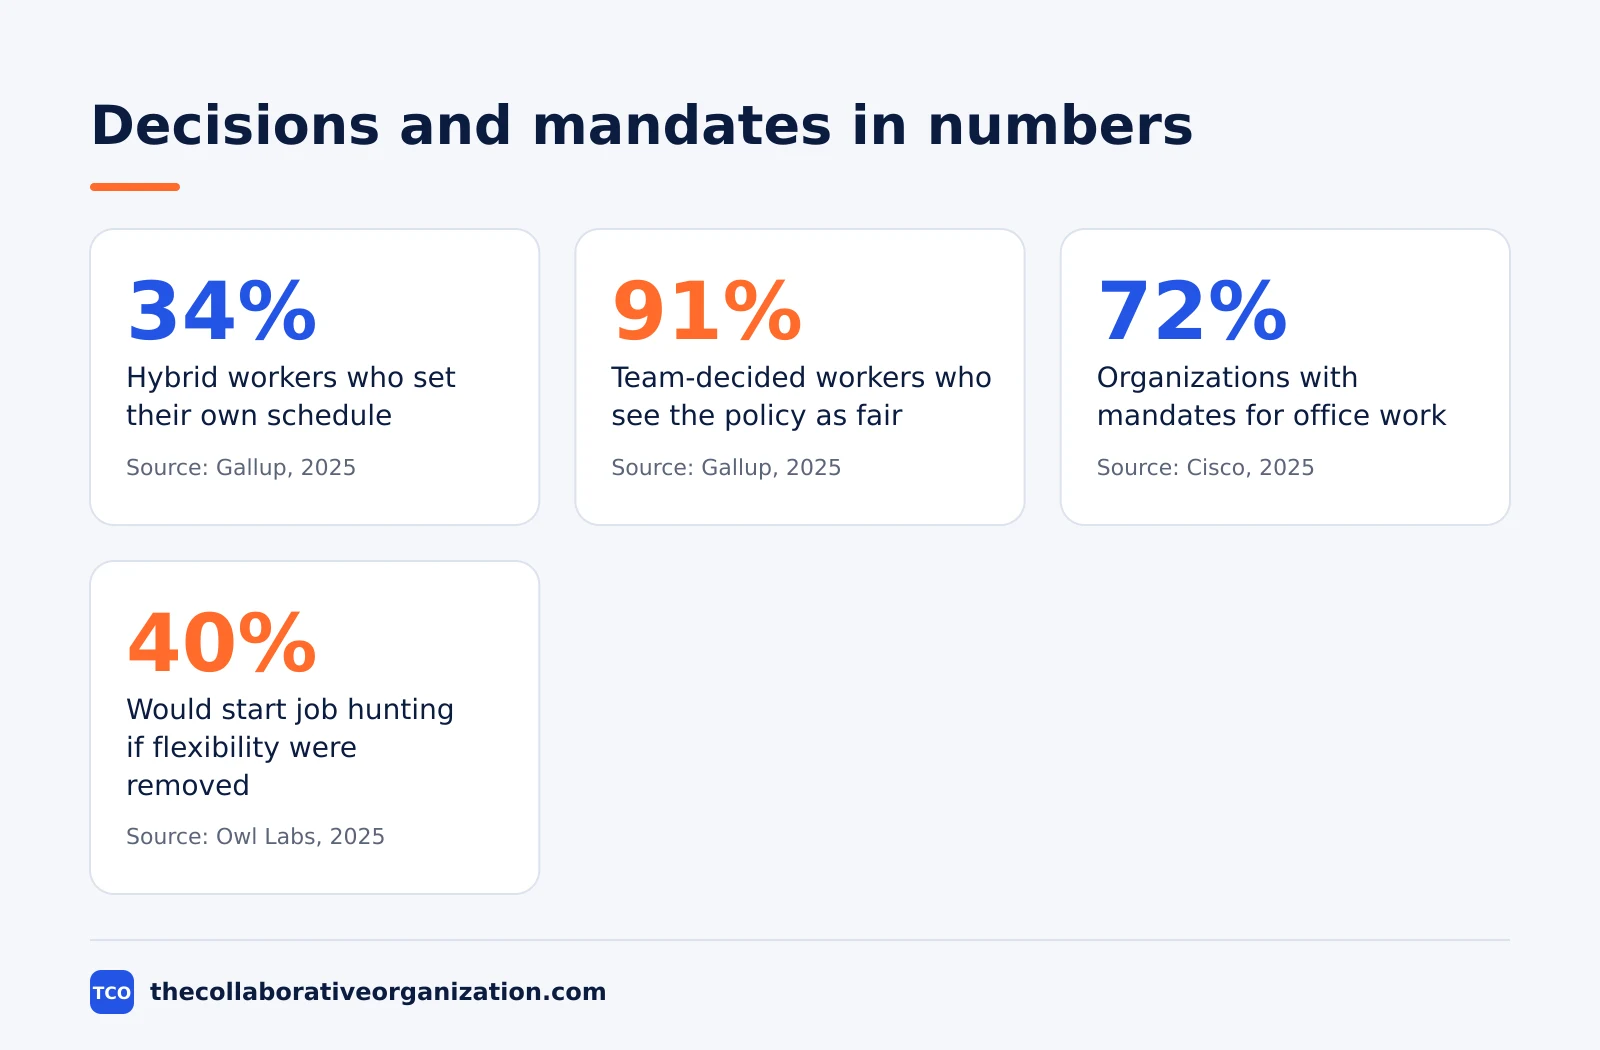
The share of hybrid workers who set their own schedule fell from 37 percent in 2024 to 34 percent in 2025. Schedules are now split three ways: 34 percent self-decided, 35 percent decided by the manager or team, and 31 percent decided by the employer or leadership, according to Gallup.
91 percent of employees whose team decides their hybrid schedule see the policy as fair, the same rate as those who decide it themselves. When the employer decides, only 73 percent see the policy as fair, according to Gallup.
Self-decided schedules carry a cost: compared with team-decided schedules, employees with self-decided schedules are 76 percent more likely to say burnout or fatigue at work is the greatest challenge, and 57 percent more likely to say reduced work-life balance is the greatest challenge, according to Gallup.
Clear goals help whichever way the schedule is set. Teams with clear, trackable goals are 20 percent more effective, and teams spend over 25 percent of their workweek searching for information, according to Atlassian’s Teamwork Lab in its State of Teams 2025 report, according to Atlassian.
Hybrid productivity and retention
Hybrid work matches office productivity and beats it on retention, and the evidence for both halves is strong. The figures below separate trials from surveys.
A randomized trial of 1,612 employees at Trip.com found two home days a week had no effect on performance grades or promotions, while resignations fell by 33 percent, from 7.2 percent to 4.8 percent. The trial ran for six months and appeared in Nature in 2024, according to the Nature study by Bloom, Han, and Liang.
69 percent of managers say hybrid and remote work has made their team more productive, in Owl Labs’ 2025 survey of 2,000 United States full-time workers, according to Owl Labs.
Cisco found the same pattern from both sides of the performance range: 50 percent of high performers work for organizations requiring less than three days in the office per week, and 81 percent of employers believe there is a direct relationship between flexibility and performance, according to Cisco.
Mandates and hybrid creep
Office mandates are rising, but most of the shift back to the office happens quietly, one day at a time. The figures below show both the formal mandates and the creep.
72 percent of organizations have mandates for working in the office, and 46 percent say their current hybrid policy requires more time in the office than the policy it replaced, while 32 percent say it has less flexibility, according to Cisco.
Only 23 percent of employers made formal changes to their remote or hybrid policies in the past year, while 73 percent did not change them, according to Owl Labs. The shift still happens, through what Owl Labs calls hybrid creep: the number of required office days rises a little each year.
If flexibility were taken away, 40 percent of workers would start job hunting, 22 percent would expect a raise to make up for the lost flexibility, and 5 percent would quit outright, according to Owl Labs.
FlexJobs found the same resistance from the other side: 76 percent of workers would look for a new job if their employer required them to work fully in person, up from 57 percent the year before, according to FlexJobs.
The pressure shows in daily life: 47 percent of workers do not have the overall work flexibility they want, and 30 percent do not have a clear start or end to their workdays, according to Owl Labs.
What the numbers mean
Hybrid work has settled into a stable pattern, and the argument now is about who sets the pattern, not whether hybrid work lasts. The adoption figures barely moved between 2022 and 2025, even as mandates rose, and the preference figures moved toward more flexibility, not less.
The most useful finding for anyone writing a policy is the one about who decides. Team-decided schedules are as fair as self-decided ones and far less likely to burn people out, while employer-decided schedules score lowest on fairness.
A policy that lets teams set their own office days, with a clear goal and a shared record of decisions, gets the benefits of hybrid work without the resentment.
The productivity evidence backs that up. Two home days a week cost nothing in performance and cut resignations by a third, and managers report better output from hybrid and remote teams.
The risk is not that hybrid workers slack off, but that a mandate written without the team behind it pushes the best people out. Our comparison of remote vs hybrid vs office work sets the three models side by side.
All 30 hybrid work statistics at a glance
Every statistic in this article, with its source and year, in one table. Use it to check a figure before you quote it.
| # | Statistic | Source | Year |
|---|---|---|---|
| 1 | 51% hybrid in May 2025; 52% as of 2026, with 26% exclusively remote and 22% on-site | Gallup | 2025 |
| 2 | 28% hybrid, 9% fully remote, 63% fully in-office among US full-time workers | Owl Labs | 2025 |
| 3 | 45% hybrid globally, down from 62% in 2022; 49% fully on-site, 6% fully remote | Cisco | 2025 |
| 4 | 41% of remote-capable workers hybrid, up from 35% in January 2022 | Pew | 2023 |
| 5 | Tech: 47% fully remote, 45% hybrid, 9% on-site | Gallup | 2025 |
| 6 | Federal hybrid fell from 61% in late 2024 to 28% in 2025; 46% fully on-site | Gallup | 2025 |
| 7 | Hybrid workers spend 46% of their workweek in the office, about 2.3 days, up from 42% in 2022 | Gallup | 2025 |
| 8 | 39% of hybrid workers go in 3 days a week; 34% go in 4 days | Owl Labs | 2025 |
| 9 | 59% of hybrid workers work from home 3 or more days in a typical week | Pew | 2023 |
| 10 | 63% of hybrid workers who are not self-employed say their employer requires in-person days | Pew | 2023 |
| 11 | 25% of employees would prefer to be in the office full time | Owl Labs | 2025 |
| 12 | 40% of workers want hybrid, 58% fully remote, 2% in-office | FlexJobs | 2025 |
| 13 | Hybrid is the most favored option, particularly among office-based workers | McKinsey | 2024 |
| 14 | 21% would like to be in the office 4 days a week, up from 17% in 2024 | Owl Labs | 2025 |
| 15 | 37% would not accept a job without flexible working hours, up from 35% in 2024 | Owl Labs | 2025 |
| 16 | 27% say a 4-day week would be appealing; workers would sacrifice 9% of salary for flexible hours, 8% for a 4-day week | Owl Labs | 2025 |
| 17 | Schedule self-decided fell from 37% in 2024 to 34% in 2025; team-decided 35%, employer-decided 31% | Gallup | 2025 |
| 18 | 91% of team-decided workers see the policy as fair, vs 73% when the employer decides | Gallup | 2025 |
| 19 | Self-decided schedules: 76% more likely to say burnout is the greatest challenge; 57% more likely reduced work-life balance | Gallup | 2025 |
| 20 | Teams with clear, trackable goals are 20% more effective | Atlassian | 2025 |
| 21 | Teams spend over 25% of their workweek searching for information | Atlassian | 2025 |
| 22 | Hybrid 2 days home: no effect on performance or promotions; resignations down 33% | Nature | 2024 |
| 23 | 69% of managers say hybrid and remote work made their team more productive | Owl Labs | 2025 |
| 24 | 50% of high performers work for organizations requiring less than 3 office days a week | Cisco | 2025 |
| 25 | 81% of employers believe there is a direct relationship between flexibility and performance | Cisco | 2025 |
| 26 | 72% of organizations have mandates for working in the office; 46% say the current policy requires more office time; 32% say less flexibility | Cisco | 2025 |
| 27 | 23% of employers made formal changes to remote or hybrid policies in the past year; 73% did not change them | Owl Labs | 2025 |
| 28 | If flexibility were removed: 40% would job-hunt, 22% would expect a raise, 5% would quit outright | Owl Labs | 2025 |
| 29 | 76% would look for a new job if forced fully in person, up from 57% | FlexJobs | 2025 |
| 30 | 47% do not have the overall work flexibility they want; 30% have no clear start or end to their workdays | Owl Labs | 2025 |
Common hybrid work statistics mistakes to avoid
Most bad statistics about hybrid work come from mixing up measures, not from making up numbers. The five mistakes below cause most of the confusion.
- Comparing a share of remote-capable workers with a share of all workers. Gallup counts remote-capable workers, Owl Labs counts all full-time workers, and their hybrid shares will not match. Say which group the figure covers.
- Quoting a mandate as if it were behavior. A company can announce five office days while its teams still work hybrid, and a policy can change on paper while nothing changes in practice.
- Treating hybrid creep as a formal mandate. The slow rise in office days happens without a policy change, so it does not show up in surveys that ask about formal policies.
- Using a 2022 figure for a 2026 decision. Hybrid shares moved between 2022 and 2025, and the 2022 figures describe a different moment.
- Hiding the sample. A statistic without a sample size, a year, and a population is a slogan. Every figure in this list carries all three, and any figure you quote should too.
When you act on these numbers, start with the trial evidence and the team-decision findings, then use the surveys to understand what workers want. Our guide on how to run a hybrid meeting shows one place where the numbers turn into practice.
The team communication software shortlist covers the tools that carry hybrid work day to day.
Our guide on how to choose team communication software walks through the choice in more detail.
Sources
- Gallup - Hybrid Work in Retreat? Barely. (2025)
- Gallup - Hybrid Work and Productivity (2026)
- Owl Labs - State of Hybrid Work 2025 (2025)
- Cisco - Global Hybrid Work Study 2025 (2025)
- Pew Research Center - About a Third of U.S. Workers Who Can Work from Home Do So All the Time (2023)
- McKinsey - Let’s Get Flexible (2025)
- FlexJobs - 2025 State of the Workforce Report (2025)
- Atlassian - How the Atlassian System of Work Connects Distributed Teams (2025)
- Nature - Hybrid Working from Home Improves Retention Without Damaging Performance (2024)
Frequently asked questions
What percentage of employees work hybrid?
Among workers whose jobs can be done remotely, Gallup found 51 percent worked hybrid in May 2025, and 52 percent as of 2026. Among all full-time workers in the United States, Owl Labs found 28 percent hybrid, 9 percent fully remote, and 63 percent fully in-office. Globally, Cisco found 45 percent hybrid in 2025, down from 62 percent in 2022.
How many days a week do hybrid workers go to the office?
Hybrid workers spend 46 percent of their workweek in the office, about 2.3 days, according to Gallup in 2025. Owl Labs found 39 percent of hybrid workers go in three days a week, the most common pattern, and 34 percent go in four days. Pew found 59 percent of hybrid workers work from home three or more days in a typical week.
Who decides a hybrid work schedule?
Gallup found the decision is split three ways: 34 percent of hybrid workers set their own schedule, 35 percent have it decided by their manager or team, and 31 percent have it set by their employer or leadership. Team-decided schedules work best: 91 percent of those workers see the policy as fair, the same rate as workers who decide it themselves.
Does hybrid work hurt productivity?
No, according to the strongest evidence available. A randomized trial of 1,612 Trip.com employees found two home days a week had no effect on performance grades or promotions, while resignations fell 33 percent. In surveys, 69 percent of managers say hybrid and remote work made their team more productive, and 81 percent of employers see a direct link between flexibility and performance.
What is hybrid creep?
Hybrid creep is the quiet rise in required office days without a formal policy change. Owl Labs coined the term for its 2025 report: 34 percent of hybrid workers now go in four days a week, up from 32 percent in 2024 and 23 percent in 2023. Only 23 percent of employers made formal changes to their remote or hybrid policies in the past year, so much of the shift happens one day at a time.
Related articles

team communication
Communication Plan for a Project: Template (2026)
A communication plan for a project names who gets which update, in which channel, how often, and from whom. Copy the template and the filled example below.
November 20, 2026 · 10 min read

team communication
How Often Should Managers Communicate With Teams? (2026)
Managers should hold one meaningful conversation with each person every week, plus a weekly team update. See the cadence table for meetings, updates and feedback.
November 20, 2026 · 9 min read
team communication
Upward Communication Examples: 10 That Work (2026)
Upward communication is a message that travels from an employee to a manager or leader. See 10 concrete examples, each with why it works and when to use it.
November 20, 2026 · 9 min read