30 Time Tracking Statistics for 2026 | The Collaborative Organization
By The Collaborative Organization Team · November 19, 2026 · Last verified November 19, 2026 · 13 min read
Thirty time tracking statistics show the same pattern: people work long days, bill about two thirds of their hours, and lose large blocks of time to messages, meetings and interruptions. The figures below come from the original studies and surveys that produced them, each with its source and year, so you can check any number before you quote it.
Key takeaways
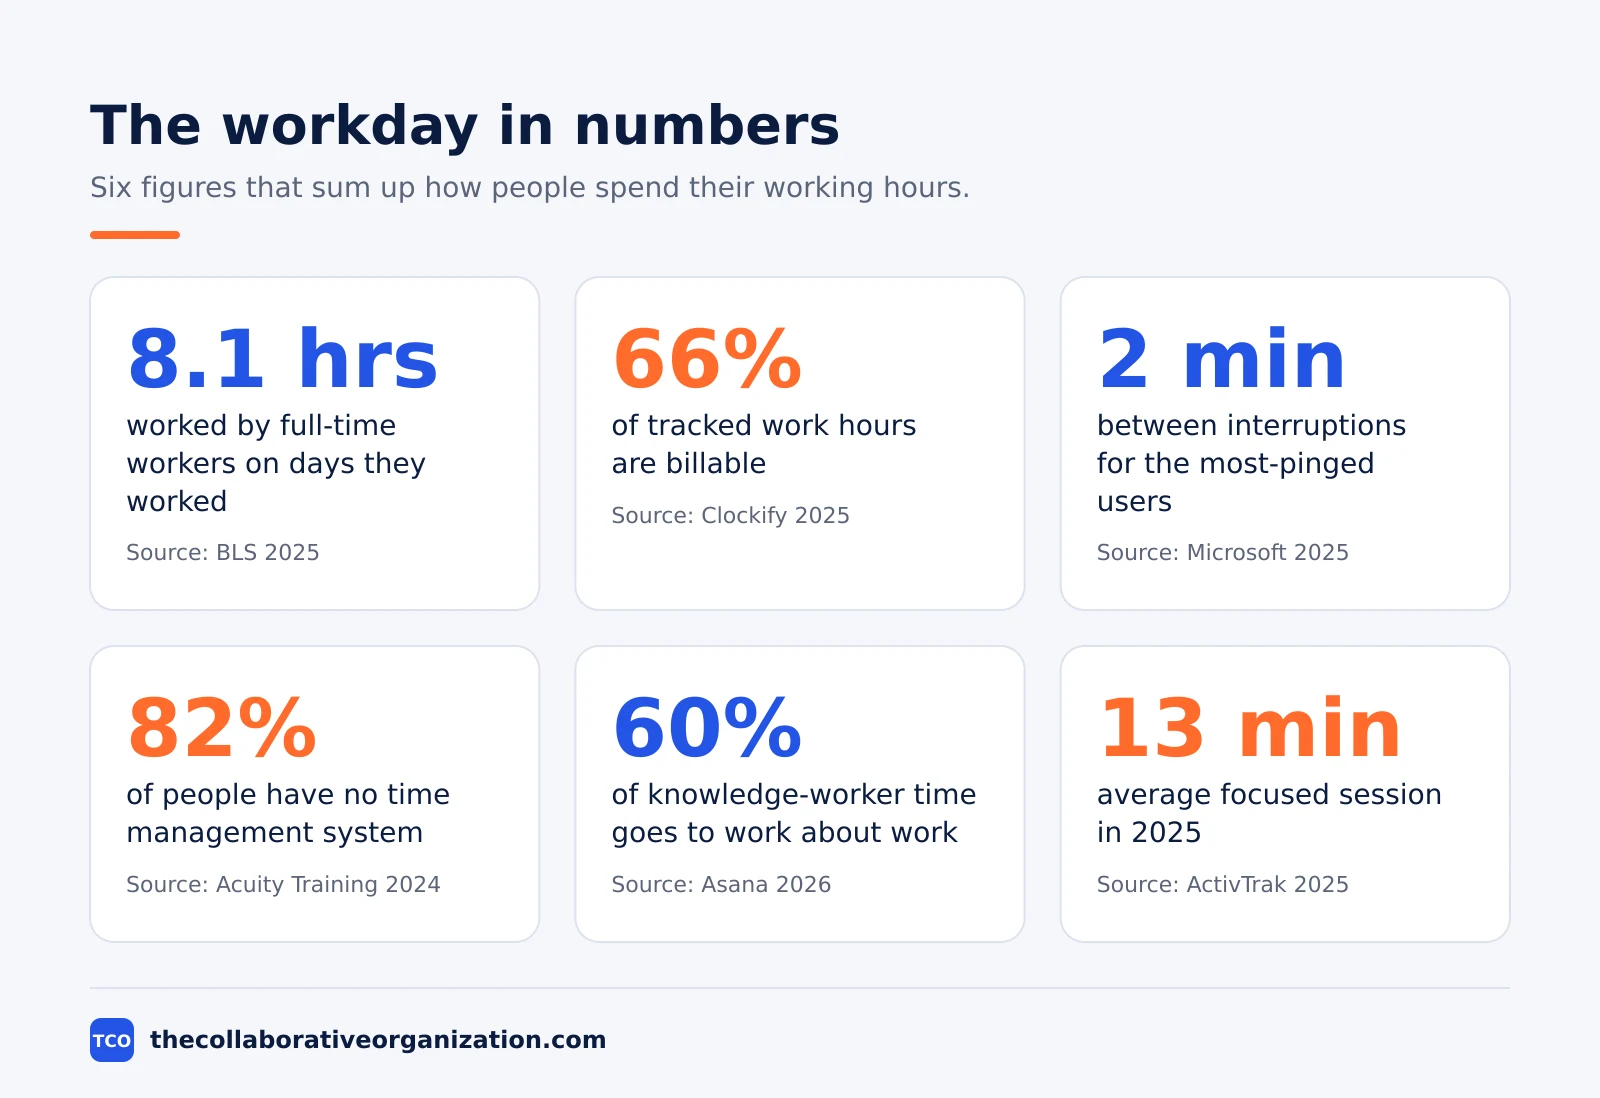
- Full-time workers in the United States worked 8.1 hours on the days they worked in 2025, and 35% did some of that work at home.
- About 66% of tracked work hours in the United States are billable, while professional services firms average 66.4% billable utilization.
- The most-pinged fifth of Microsoft 365 users are interrupted every 2 minutes, about 275 times a day.
- Knowledge workers spend 60% of their time on “work about work”, not on the skilled work they were hired to do.
- Only 18% of people use a dedicated time management system, and 82% have none at all.
- Global engagement fell from 23% to 21% in 2024, a drop Gallup puts at $438 billion in lost productivity.
The 30 statistics at a glance
This table lists all 30 statistics, each with its original source and year. The sections that follow explain the numbers in groups, so you can read the table for the figure and the text for what it means.
| Statistic | Source | Year |
|---|---|---|
| Full-time workers averaged 8.1 hours on days they worked | BLS | 2025 |
| 35% of employed people did some or all of their work at home | BLS | 2025 |
| Americans slept 9 hours and 1 minute on a typical day | BLS | 2025 |
| Americans spent 3 hours and 25 minutes a day on work and work-related activities | BLS | 2025 |
| Mexico: 2,205.4 hours worked per person per year, the highest in the OECD | OECD | 2025 |
| Germany: 1,332.2 hours worked per person per year, the lowest in the OECD | OECD | 2025 |
| 66% of tracked work hours in the United States are billable, 34% are not | Clockify | 2025 |
| Average billable utilization in professional services fell to 66.4% | Deltek | 2025 |
| 75% billable utilization is the benchmark for high-performing firms | Deltek | 2025 |
| Lawyers bill about 38% of an 8-hour day, or 3.0 billable hours | Clio | 2025 |
| Law firms invoice 88% of the billable work they record | Clio | 2025 |
| The most-pinged fifth of users are interrupted every 2 minutes, 275 times a day | Microsoft | 2025 |
| The average worker receives 117 emails and 153 Teams messages a day | Microsoft | 2025 |
| 48% of employees say their work feels chaotic and fragmented | Microsoft | 2025 |
| 57% of meetings are ad hoc calls with no calendar invite | Microsoft | 2025 |
| Interrupted work was resumed after 25 minutes and 26 seconds on average | Mark et al. | 2005 |
| 57% of working spheres were interrupted in the field study | Mark et al. | 2005 |
| The average focused session lasted 13 minutes and 7 seconds | ActivTrak | 2025 |
| Managers spent 18 hours and 34 minutes a month in meetings, employees 10 hours and 12 minutes | DeskTime | 2024 |
| Knowledge workers spend 60% of their time on work about work | Asana | 2026 |
| 103 hours a year go to unnecessary meetings per knowledge worker | Asana | 2026 |
| 209 hours a year go to duplicative work per knowledge worker | Asana | 2026 |
| 352 hours a year go to talking about work per knowledge worker | Asana | 2026 |
| 88% of the workweek is spent communicating with others | Grammarly | 2024 |
| 82% of people have no dedicated time management system | Acuity Training | 2024 |
| People spend 62% of the workday on mundane, recurring tasks | Clockify | 2023 |
| Top performers work 75 minutes, then rest for 33 minutes | DeskTime | 2025 |
| Daily AI users are 64% more likely to report very good productivity | Slack | 2025 |
| 80% of employees now use AI tools at work | ActivTrak | 2025 |
| Global engagement fell from 23% to 21%, costing $438 billion in lost productivity | Gallup | 2025 |
How the workday is actually spent
Full-time workers in the United States worked 8.1 hours on the days they worked in 2025, and 35% of employed people did some of that work at home. The Bureau of Labor Statistics American Time Use Survey also found that full-time workers put in 8.5 hours on an average weekday and 5.5 hours on an average weekend day.
Sleep still takes the largest share of the day. Americans slept 9 hours and 1 minute on a typical day in 2025, and spent 3 hours and 25 minutes on work when the average covers everyone, including people who did not work that day.
Time spent socializing fell to 35 minutes a day in 2025, down from 41 minutes in 2015.
The gap between countries is wide. Mexico recorded 2,205.4 hours worked per person in 2025, the highest in the OECD data, while Germany recorded 1,332.2 hours, the lowest.
That is a gap of more than 800 hours a year, or about 45.9 hours a week in Mexico against 27.7 hours a week in Germany. Hours alone say nothing about output, so use the comparison to set expectations about working time, not to judge how hard people work.
Billable hours: how much time turns into money
About two thirds of tracked work hours in the United States are billable, and the rest is the admin, sales and training work that keeps a firm running. Clockify data from 2,300 US firms in 2025 puts the split at 66% billable and 34% non-billable, and our guide on billable versus non-billable hours explains how to draw the line between the two.
The benchmark for professional services is lower than most firms expect. Deltek’s summary of the 2026 SPI Professional Services Maturity Benchmark puts average billable utilization at 66.4% in 2025, the lowest in the survey’s history, against a 75% mark for high performers.
Average project margin in the same benchmark was 37.7% in 2025, and revenue per billable consultant reached $210,000.
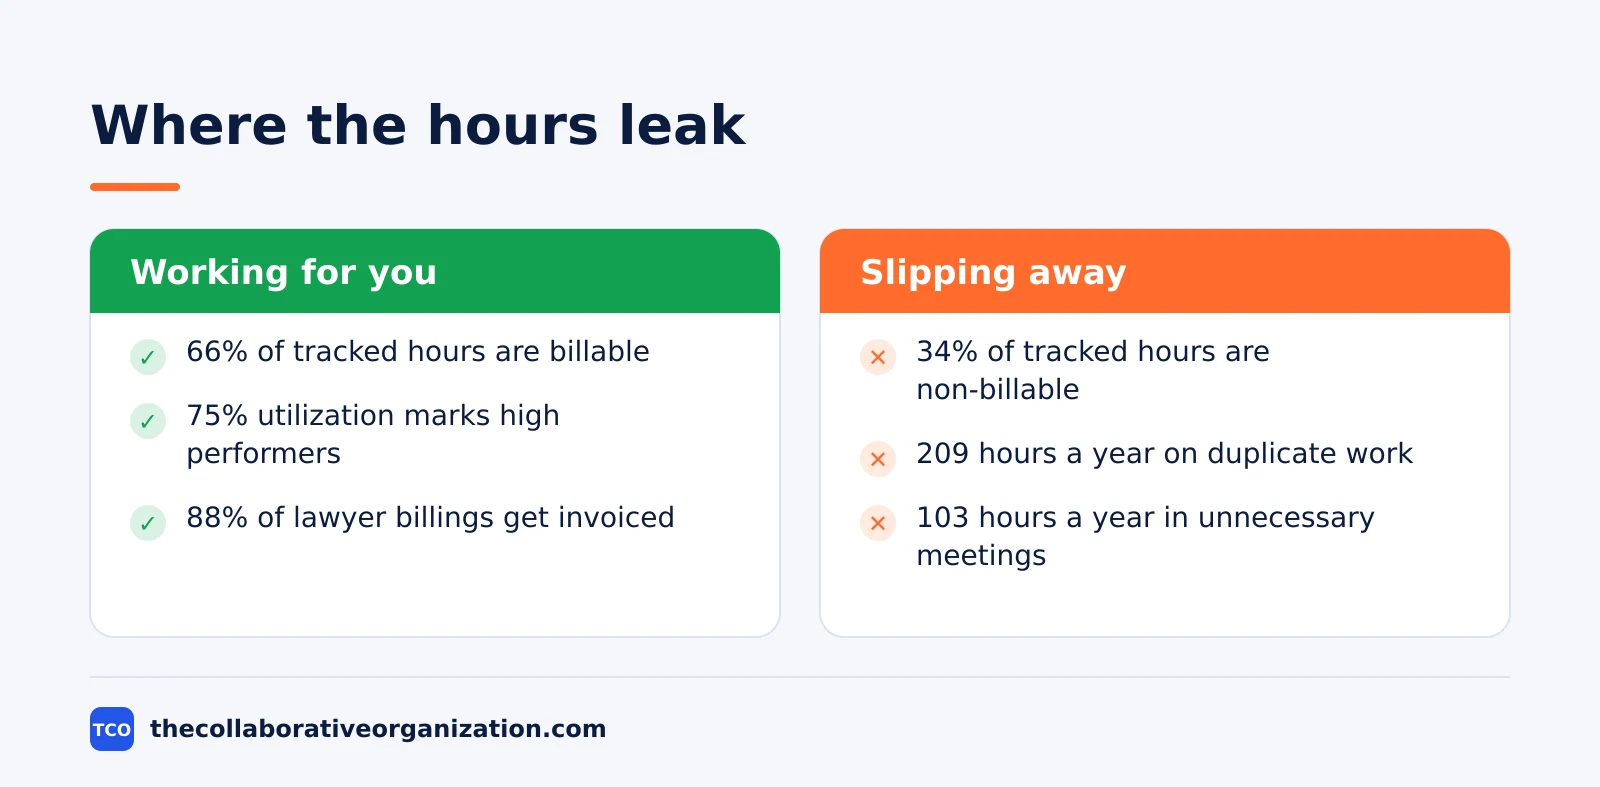
Law is the hardest test of the billable hour. Clio’s Legal Trends Report puts the average lawyer’s utilization at 38% in 2025, or about 3.0 billable hours in an 8-hour day.
Firms invoice 88% of the billable work they record, so a full day of effort becomes roughly 2.4 hours of collected time. If your team bills by the hour, the fix is rarely more hours: it is fewer hours lost to work that never gets recorded.
Interruptions: the two-minute workday
The most-pinged fifth of Microsoft 365 users are interrupted about every 2 minutes during core hours, or roughly 275 times a day. Microsoft’s Work Trend Index special report, published in June 2025, bases that figure on anonymized Microsoft 365 signals through 15 February 2025, and it counts pings from meetings, email and chat.
The volume behind the interruptions is just as stark. The average worker receives 117 emails a day, most skimmed in under 60 seconds, and 153 Teams messages on a weekday. In the survey of 31,000 knowledge workers behind the same report, 48% of employees and 52% of leaders said their work feels chaotic and fragmented.
Field research puts a price on each break. In a 2005 study that shadowed 24 information workers, 57% of their working spheres were interrupted, and interrupted work was resumed after an average of 25 minutes and 26 seconds.
The paper is Mark, Gonzalez and Harris, CHI 2005. Note that the famous 23 minutes and 15 seconds figure comes from a 2006 interview, not from that paper, and it measures time until work resumed.
Logged data shows focus sessions are shrinking. ActivTrak’s 2026 State of the Workplace report, built on 443 million hours of work activity, found the average focused session lasted 13 minutes and 7 seconds in 2025, down 9% from 2023.
RescueTime’s own analysis of its users found most people check email or chat every 6 minutes or less. If you want fewer interruptions, our guide on how to avoid task switching covers the practical steps.
Meetings and communication: where the hours go
Knowledge workers spend 60% of their time on work about work, and only 40% on the skilled work they were hired to do. Asana’s Anatomy of Work Index, based on more than 10,000 knowledge workers, breaks the cost down per person per year: 103 hours in unnecessary meetings, 209 hours on duplicative work, and 352 hours talking about work.
Managers carry the heaviest meeting load. DeskTime’s study of more than 40,000 workers across 2024 found managers spent 18 hours and 34 minutes a month in meetings, against 10 hours and 12 minutes for employees. Managers were also less effective by DeskTime’s measure, at 51.78% against 58.72% for employees, and logged fewer productive hours a day.
Meetings also crowd out the best hours. Half of all meetings take place between 9 and 11 in the morning and 1 and 3 in the afternoon, the windows Microsoft identifies as peak focus time, and 57% of meetings are ad hoc calls with no calendar invite.
Grammarly’s research puts the total communication load at 88% of the workweek spent communicating with others across channels. For a plan to cut the load, see how to reduce meetings at work.
Time management habits: who has a system
Only 18% of people use a dedicated time management system, so 82% manage their time with lists, inboxes or habit. Acuity Training’s 2024 survey of 500 working people found a third relied on to-do lists and about a quarter worked out of their email inbox, while only 20% said they felt in control of their work every day.
The cost of having no system shows up in repetition. Asana’s 2023 Anatomy of Work Index, quoted on Clockify’s research page, found people spend about 62% of the workday on mundane, recurring tasks, and only 27% of their time on tasks they were trained for and hired to do.
The average worker also spends 4 hours and 38 minutes a week on duplicate tasks, work someone already did.
Rest is part of the system, not a break from it. DeskTime’s latest data shows the most productive workers now average 75 minutes of work followed by 33 minutes of rest, a shift from 52 minutes on and 17 off in 2014 and 112 on and 26 off in 2021.
The Pomodoro technique builds that rhythm into a day with timed work and rest blocks.
Time blocking does the same thing by giving each task a named slot on the calendar.
AI is changing the picture fast. In Slack’s Workforce Index survey of 5,156 desk workers in 2025, daily AI users were 64% more likely to report very good productivity than colleagues who did not use AI.
They were also 81% more likely to report very good job satisfaction. ActivTrak’s data puts AI use at 80% of employees in 2025, up from 53% in 2023. Treat the Slack figures as self-reported: they show how AI users feel about their work, not a measured output gain.
What the numbers mean for your team
The numbers point to one fix: protect focus time, then bill the time you already work. A team that tracks its hours for one month usually finds the same three leaks: meetings with no clear outcome, duplicate work, and hours that were never recorded.
Take a 10-person team as an illustration. At 2,080 working hours a year per person, the team has 20,800 hours. At the 66.4% utilization average from the SPI benchmark, it bills 13,811 hours.
At the 75% high-performer mark, it bills 15,600 hours. The gap is 1,789 hours a year, and at $150 an hour that is $268,350 of unbilled capacity. No extra hiring is needed to close it: the hours are already being worked.
A public-sector trial shows what tracking can do in practice. Latvia’s Ministry of Economics introduced DeskTime in February 2025, and after a year its productivity measure rose from 80% to 92%, with staff spending 7.3 hours a day on direct work tasks. The ministry’s own account credits faster decisions and shorter coordination cycles, not longer hours.
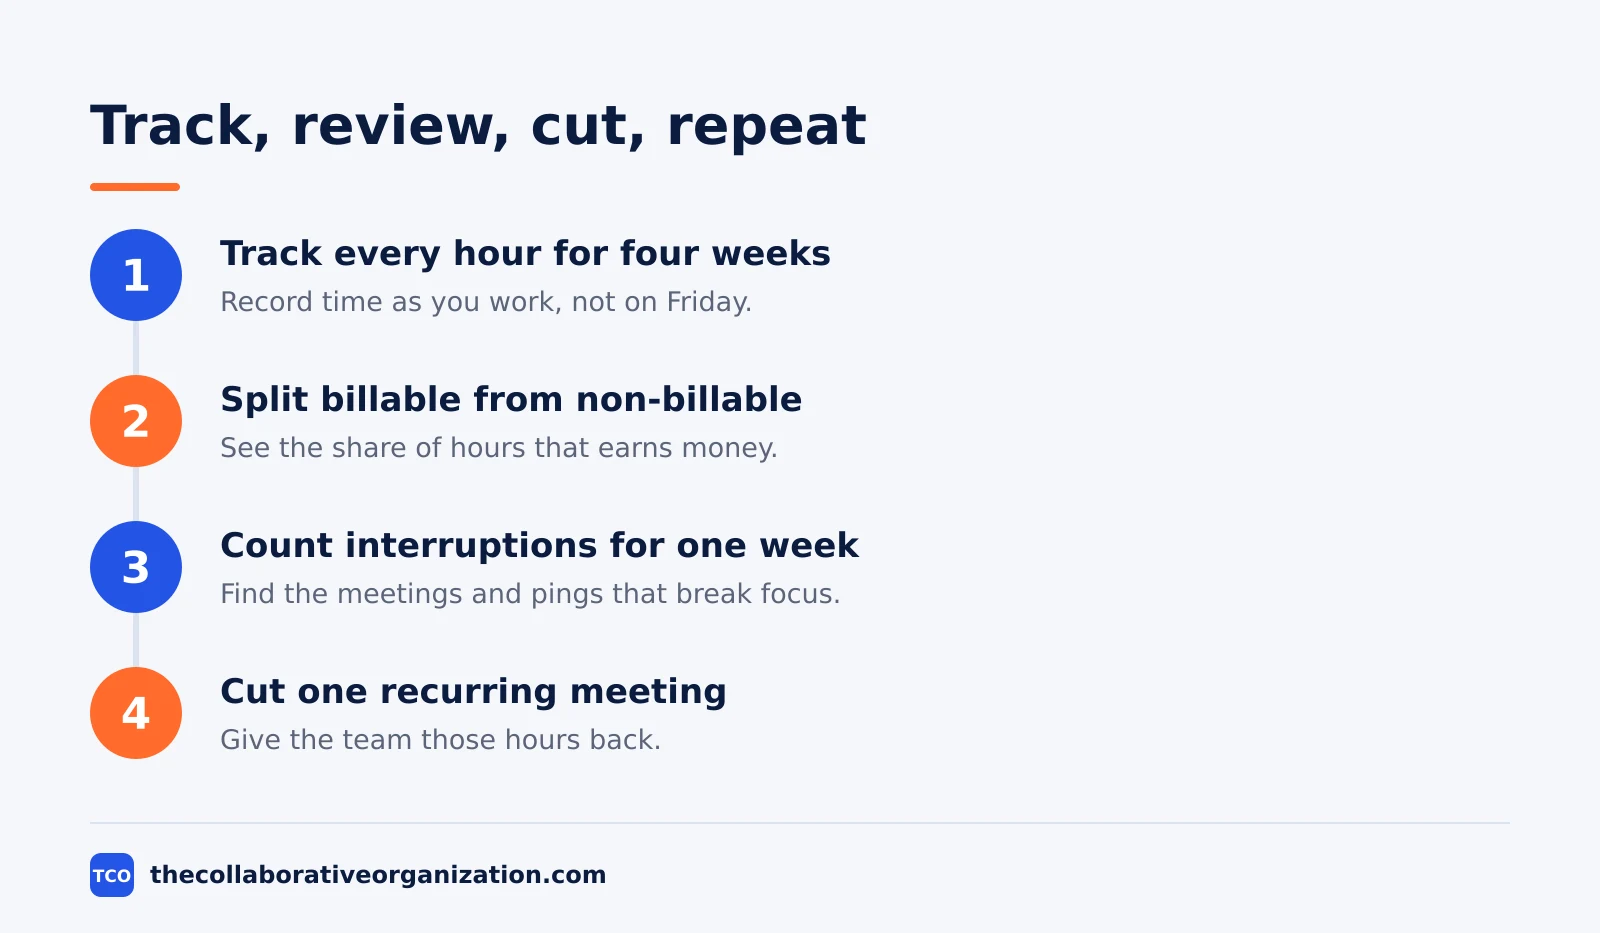
Start with the cheapest measure first. Track every hour for four weeks, split billable from non-billable, and count interruptions for one week.
Then cut one recurring meeting, write down who owns each task, and record time as you work instead of reconstructing it at the end of the week. Our guide on how to estimate project time shows how to turn those tracked hours into better estimates.
How we chose these 30 statistics
Every number in this article links to the original study, survey or report that produced it, or it was left out. We did not use stats-roundup sites as the source of any figure, and we did not use a number we could not trace to a published study.
Where an original study sits behind a member wall, we linked the closest reputable summary and said so. The Gloria Mark figures come from the peer-reviewed CHI 2005 paper, and the ActivTrak figures come from the company’s own 2026 State of the Workplace report.
Two figures need a note. The OECD hours are shown through the OECD Data Explorer, which returned an error to our fetcher on 19 November 2026, so the figures are quoted from the OECD 2025 dataset as read that day.
The Toggl figures come from Toggl’s own Productivity Index survey of 466 business leaders, which is vendor research, so read them as a survey of leaders, not as logged behavior.
We also corrected two figures that circulate widely in the wrong form. The 23 minutes and 15 seconds refocus figure is elapsed clock time from a 2006 interview, not a peer-reviewed finding; the paper’s own figure is 25 minutes and 26 seconds.
And the $450 billion annual cost of interruptions could not be traced to any primary study, so it is not in this article. Gallup’s $438 billion figure is different: it is the cost Gallup attached to the 2024 fall in engagement in its 2025 report.
Common time tracking mistakes to avoid
Most time tracking fails because the data is never used, not because the tool is wrong. Run through this list before you blame the software.
- Tracking everything and reviewing nothing. A timesheet nobody reads is admin work with no return, so set a weekly 15-minute review.
- Counting hours instead of outcomes. Toggl’s Productivity Index found 41% of leaders still use total hours as their main productivity metric, while 87% agree that focusing on outcomes would improve revenue.
- Treating all non-billable time as waste. Admin, training and sales keep the firm running, so protect a fixed share of the week for them instead of trying to bill every hour.
- Reconstructing timesheets on Friday. Memory fades fast, and hours that are not recorded are hours that are never billed, so log time as you work.
- Surveillance instead of visibility. In Toggl’s survey, 70% of leaders felt comfortable with surveillance software, but 65% admitted those same policies drive disengagement, so show people their own data first.
- Quoting a statistic without its year or sample. A 2005 field study of 24 people is not a 2025 survey of 31,000, so always name the source, the year and the sample before you use a number.
Sources
- BLS - American Time Use Survey, 2025 Results (2026)
- OECD - Hours Worked, Data Explorer (2025)
- Microsoft - Breaking Down the Infinite Workday, Work Trend Index (2025)
- Gallup - State of the Global Workplace 2025 (2025)
- Clockify - Time Tracking Statistics for 2026 (2026)
- Deltek - 5 KPIs from the SPI Professional Services Maturity Benchmark (2026)
- Clio - Legal Trends Report (2025)
- Slack - The New AI Advantage, Workforce Index (2025)
- DeskTime - Managers vs Employees: Time Spent in Meetings (2025)
- Toggl - What Is Employee Productivity (2025)
Frequently asked questions
What percentage of work hours are billable?
In the United States, 66% of tracked work hours are billable and 34% are non-billable, according to Clockify data from 2,300 US firms in 2025. The share varies by industry: lawyers bill about 38% of an 8-hour day, while professional services firms average 66.4% billable utilization, so a healthy target sits near 70 to 75%.
How often are workers interrupted during the day?
The most-pinged fifth of Microsoft 365 users are interrupted about every 2 minutes during core hours, or roughly 275 times a day, according to Microsoft's 2025 Work Trend Index. The average worker receives 117 emails and 153 Teams messages a day, and half of all meetings fall in the 9 to 11 in the morning and 1 to 3 in the afternoon windows.
How long does it take to get back to work after an interruption?
In a 2005 field study of 24 information workers, interrupted work was resumed after an average of 25 minutes and 26 seconds, with about two other tasks handled in between. The often-quoted figure of 23 minutes and 15 seconds comes from a 2006 interview, not the peer-reviewed paper, and it measures time until work resumed, not time to refocus.
How many hours a year do people work in different countries?
Mexico tops the OECD list at 2,205.4 hours worked per person per year in 2025, while Germany is lowest at 1,332.2 hours. The gap is more than 800 hours a year, which works out to about 45.9 hours a week in Mexico against 27.7 hours a week in Germany.
Do most people have a time management system?
No. In Acuity Training's 2024 survey of 500 working people, only 18% said they used a dedicated time management system, so 82% had none. A third relied on to-do lists and about a quarter worked out of their email inbox, and only 20% said they felt in control of their work every day.
Does time tracking improve productivity?
Tracking alone changes nothing, but the numbers it produces change decisions. One public-sector trial in Latvia saw productivity rise from 80% to 92% after a year of time tracking, with staff spending 7.3 hours a day on direct work. The gain came from seeing where time went and cutting the rest, not from watching people work.
Related articles

project management
How to Choose Project Management Software (2026)
Pick project management software in seven steps: define the work, count seats, price the real cost, and run a two-week pilot before you pay.
November 19, 2026 · 10 min read
project management
What Is a RACI Matrix? Definition, Roles and Examples (2026)
A RACI matrix maps who is Responsible, Accountable, Consulted and Informed for each task. Learn the four roles, how to build one, and see a worked example.
November 19, 2026 · 9 min read
project management
Daily Standup Meeting Format That Works (2026)
A daily standup is a 15-minute meeting where Developers inspect progress toward the Sprint Goal and plan the next day. Use this format to run one that ends on time.
November 19, 2026 · 10 min read