How to Estimate Project Time: 4 Techniques That Work (2026) | The Collaborative Organization
By The Collaborative Organization Team · November 19, 2026 · Last verified November 19, 2026 · 10 min read

To estimate project time, break the work into small tasks and estimate each one with a technique that fits how much you know. A single guess invites optimism bias. A range built from three numbers tells the truth about uncertainty and still gives the team a date to aim for.
Key takeaways
- Estimate at the task level, never at the project level: split work into tasks of half a day to two weeks first.
- Four core techniques trade speed for accuracy: analogous is fastest and roughest, bottom-up is slowest and most exact.
- Three-point estimation uses optimistic, most likely and pessimistic times in the formula E = (O + 4M + P) / 6.
- The spread between optimistic and pessimistic times measures uncertainty: a wide spread means investigate before you commit.
- Roll up only the tasks on the critical path to get the project date, and keep the buffer visible as its own line.
What a good time estimate looks like
A good time estimate states a range, names its basis, and separates the work from the buffer. A date with no range pretends the future is certain. A range with no basis is just a wider guess. The estimate should say which technique produced it, which tasks it covers, and how much cover sits on top.
Start by breaking the project into tasks small enough to judge. Three-point estimation works at the task level, not the project level, as Rework stresses in its guide: estimating a vague design phase as one unit produces unreliable results. Aim for tasks that take between half a day and two weeks, and split anything larger first.
Then pick the technique by the stage of the project. Early on, with little detail, use analogous estimation against a past project. Once the scope is clear, use parametric rates for repeatable work and bottom-up sums for the baseline. Use three-point estimation for the few tasks that genuinely worry you, where the range between best and worst case is wide.
The four core techniques compared
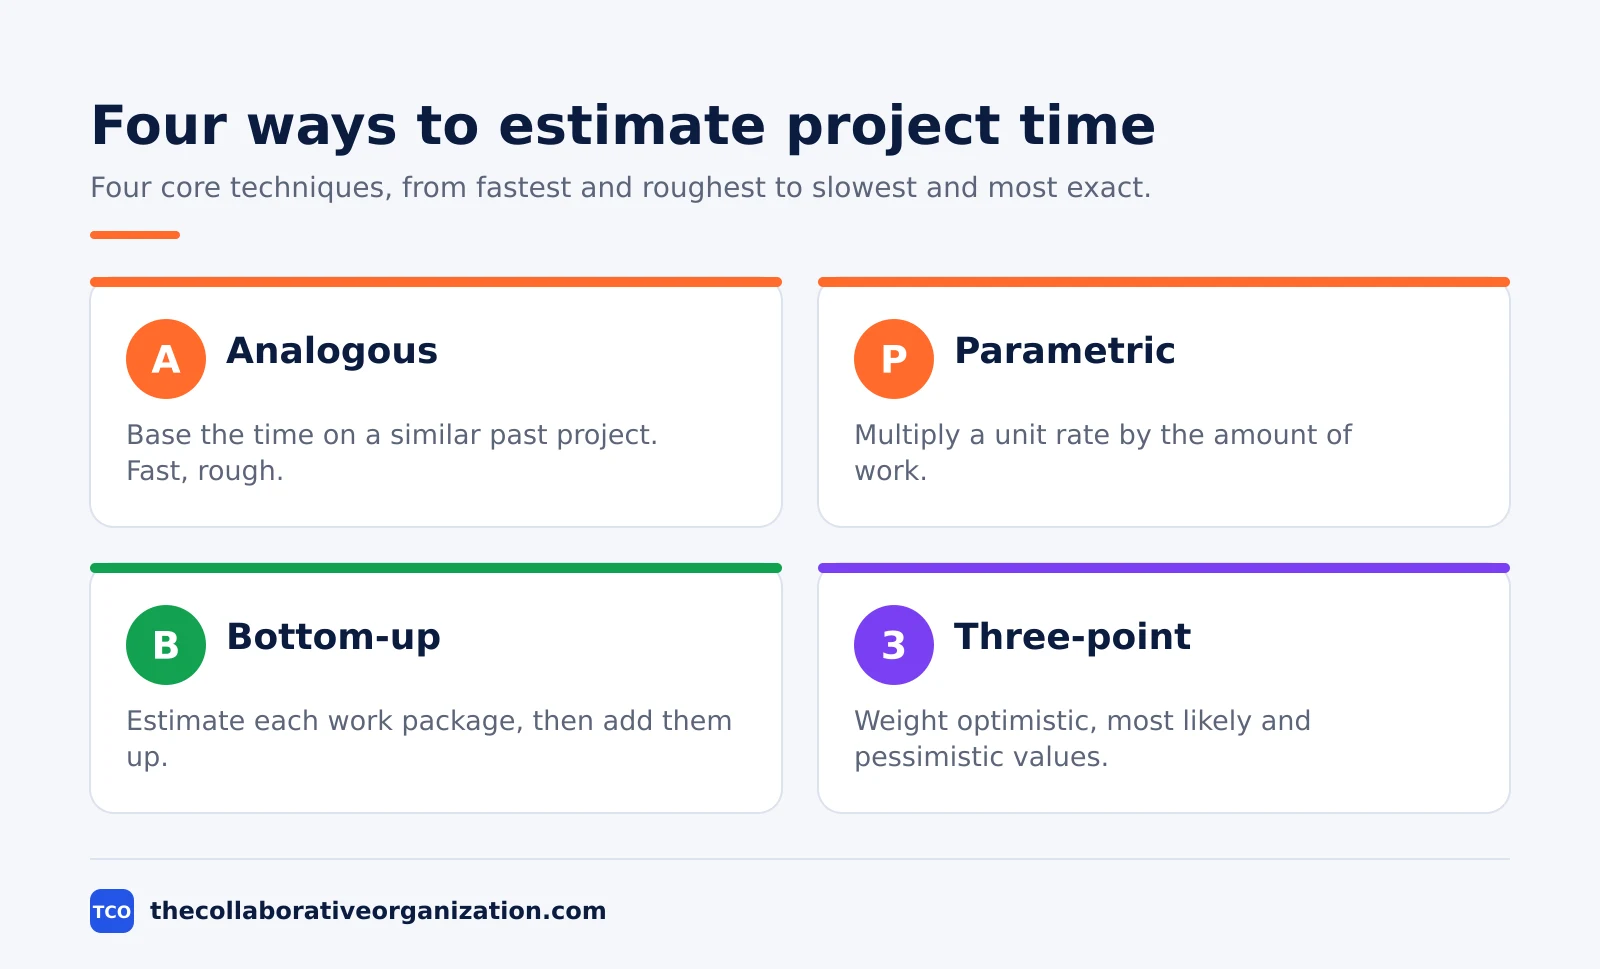
The four core techniques trade speed for accuracy, so the right one depends on how much detail you have. Analogous is fastest and least accurate. Bottom-up is slowest and most exact. Parametric and three-point sit between them, and most projects use more than one.
| Technique | How it works | Accuracy | Best when |
|---|---|---|---|
| Analogous | Base the time on a similar past project | Low | Early on, with little detail |
| Parametric | Multiply a unit rate by the amount of work | Medium to high | A reliable rate per unit exists |
| Bottom-up | Estimate each work package and add them up | Highest | A full task list is ready |
| Three-point | Weight optimistic, most likely and pessimistic times | Medium to high | Times are uncertain |
Analogous estimation, also called top-down estimation, uses real times from a similar past project and adjusts for known differences. Projeric gives the plain example: the last office fit-out took a set number of weeks, so this one should take a similar time. It only works when the past project truly matches, not just in appearance.
Parametric estimation scales a known rate: if one report takes 2 hours and the project needs 40 reports, the estimate is 80 hours. Bottom-up estimation prices every work package from the work breakdown structure and sums them, which is why it is the most accurate and the most work.
A rough order of magnitude estimate early on can range from 25% under to 75% over, while a definitive bottom-up estimate aims for 5% under to 10% over.
Three-point estimation step by step
Three-point estimation turns one guess into three, then blends them into an expected time and a confidence range. The method comes from PERT, the Program Evaluation and Review Technique, which the U.S. Navy built in 1958 to manage the Polaris missile program. PERT was designed for work with real uncertainty, where past data is thin and the range of outcomes is wide.
Step 1: Break the work into tasks
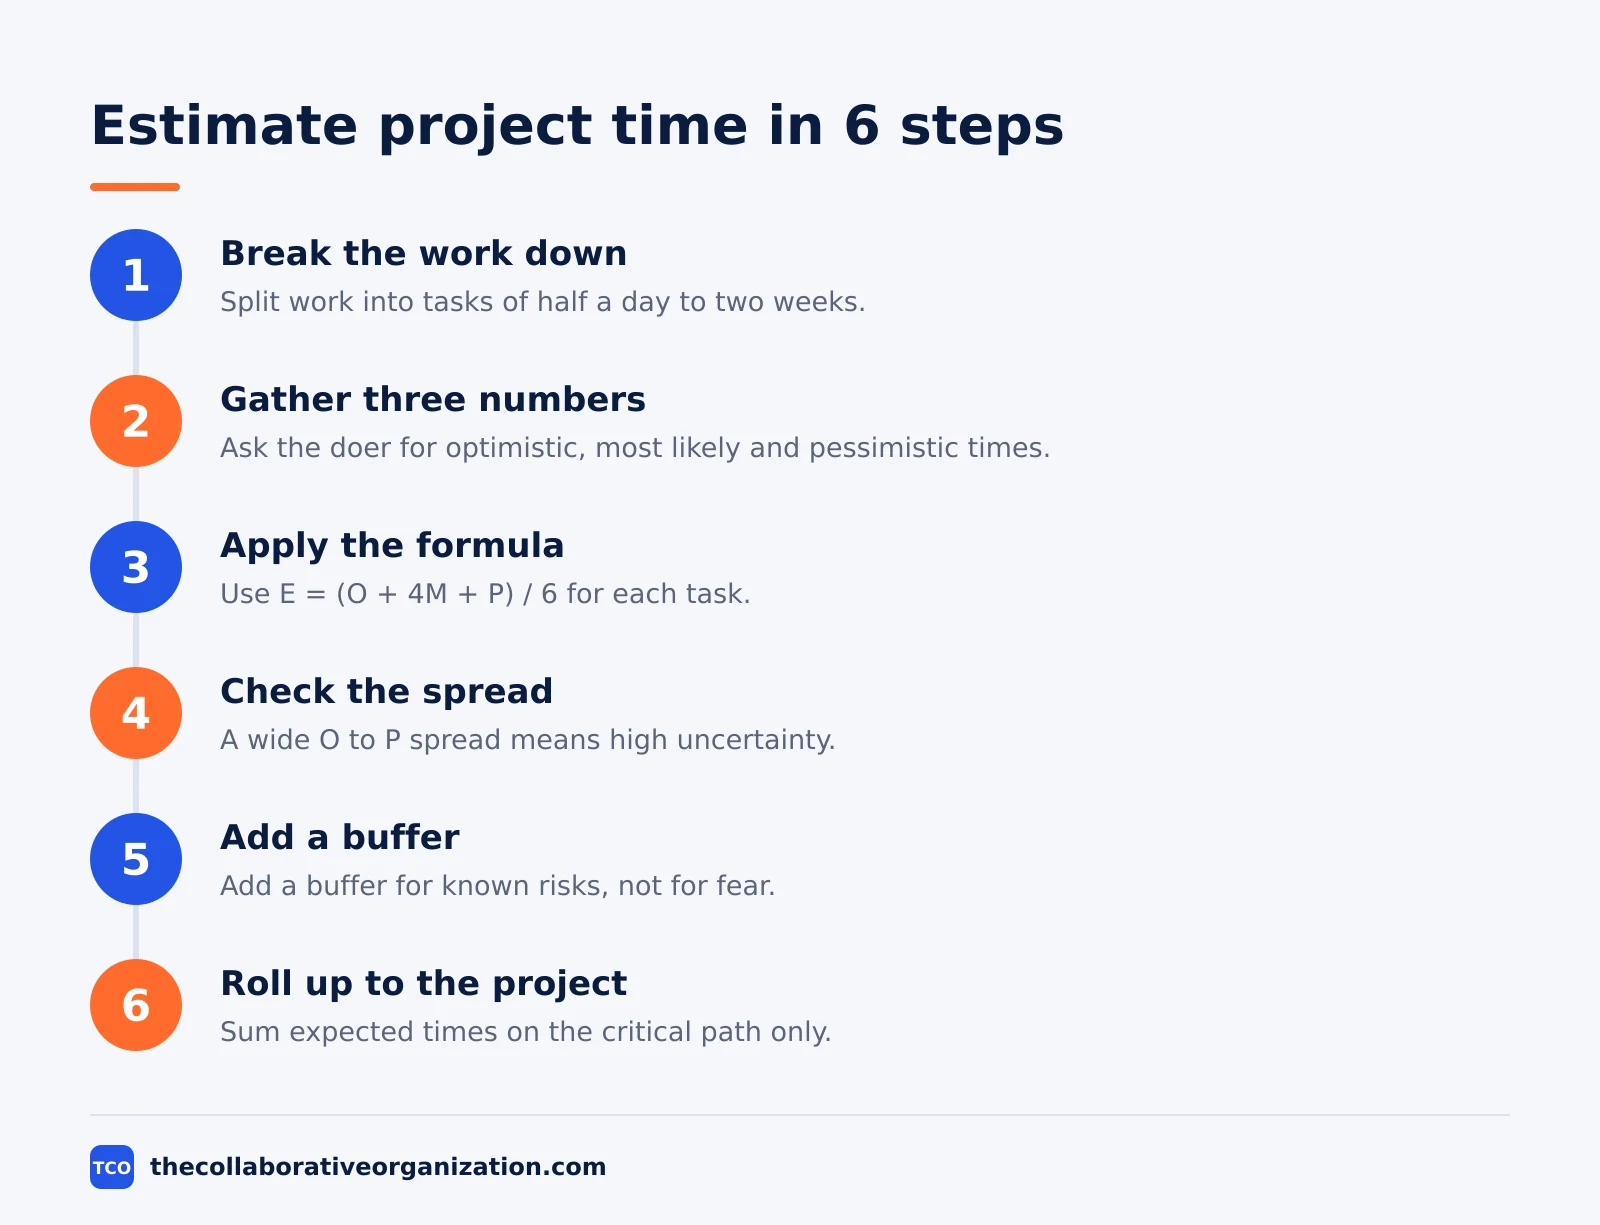
Start with a work breakdown structure that divides the project into work packages small enough to estimate well. Three-point estimation works at the task level, and tasks of half a day to two weeks give the best results. Anything larger should be split before you ask for numbers.
Step 2: Gather three numbers per task
Ask the person who will do the work for three times: optimistic (O), most likely (M), and pessimistic (P). Ask for M first, then expand outward. Rework warns that asking for O and P first anchors M and distorts it. For tasks with no past example, widen P on purpose: underestimating P is the most common mistake in this method.
Step 3: Apply the PERT formula
Use the weighted formula E = (O + 4M + P) / 6, which gives the most likely time four times the weight of the other two. The simple average, E = (O + M + P) / 3, treats all three as equal and suits a quick early check. For formal scheduling, use the PERT formula, since it damps extreme values that estimators often add to protect themselves.
Step 4: Check the spread
Compute the standard deviation, SD = (P - O) / 6. A task with SD of 0.5 days is far more predictable than one with SD of 3 days. A narrow spread, such as O=4, M=5, P=6, signals a task the team understands. A wide spread, such as O=3, M=8, P=20, signals high uncertainty and should prompt deeper investigation before the task starts.
Step 5: Add a buffer for known risks
Turn the SD into a range: E plus or minus 1 SD covers about 68% of outcomes, plus or minus 2 SD covers about 95%, and plus or minus 3 SD covers about 99.7%. Present the 95% range to stakeholders, and hold a separate contingency for risks you can name. Asana advises the same habit in its resource guide: estimate in ranges, include risks, and use the same technique each time so estimates stay comparable.
Step 6: Roll up to the project date
Sum the expected times of the tasks on the critical path only. Tasks off the critical path have float, so their overruns need not move the end date. For the project standard deviation, use the root sum of squares of the critical-path SDs. Our guide to calculating the critical path shows how to find which tasks sit on it.
From task estimates to a project date
A project date comes from the critical path, not from adding up every task in the project. Tasks that run in parallel do not add to the end date. Only the longest chain of dependent tasks sets the finish, so the roll-up must follow the network, not the task list.
That is why dependencies matter to estimation: if two tasks must run in sequence, their times add, and if they can overlap, only the longer one counts toward the date. A schedule built without dependencies shows a date that looks tidy and means nothing. Map the links first, then add the numbers.
The same logic applies to the buffer: padding every task hides cover inside the schedule and teaches the team to spend it.
A buffer held at the project level, visible as its own line, protects the date without hiding real task times. When a task finishes early the buffer grows, and when a critical task slips the buffer absorbs it, so the end date holds.
Worked example: a 3-task feature release
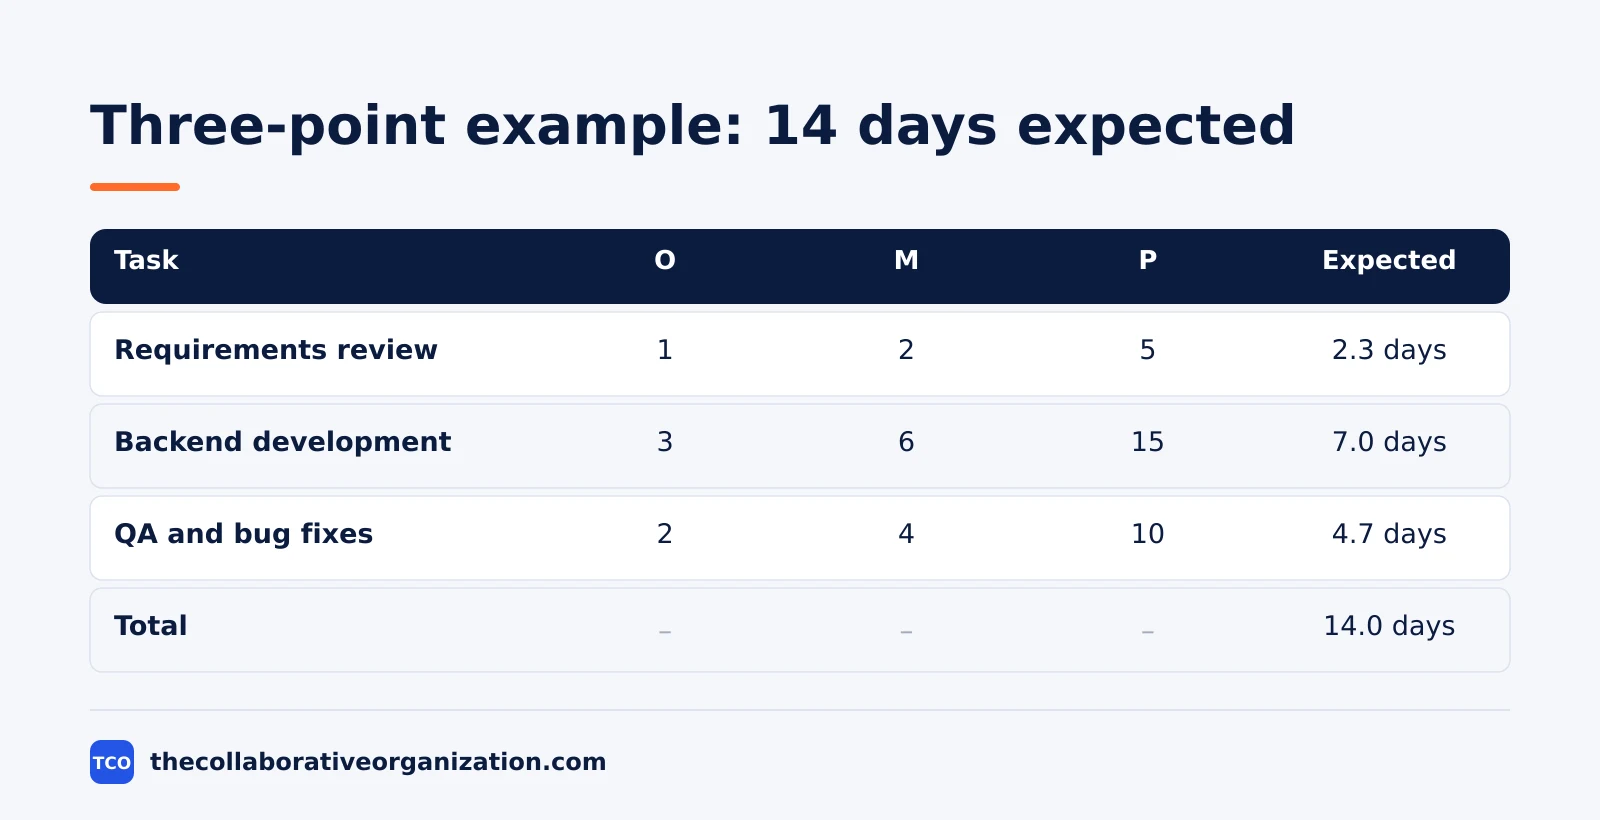
A software team estimating three tasks for a feature release can show the whole method in one table. This is an illustration using task inputs from a worked example published by Rework, with the arithmetic shown so you can check it.
| Task | O (days) | M (days) | P (days) | Expected (days) | SD (days) |
|---|---|---|---|---|---|
| Requirements review | 1 | 2 | 5 | 2.3 | 0.67 |
| Backend development | 3 | 6 | 15 | 7.0 | 2.00 |
| QA and bug fixes | 2 | 4 | 10 | 4.7 | 1.33 |
| Total | - | - | - | 14.0 | 2.49 |
Check the backend row: E = (3 + 24 + 15) / 6 = 42 / 6 = 7.0 days, and SD = (15 - 3) / 6 = 2.0 days.
The project SD is the root sum of squares: the square root of (0.67 squared + 2.00 squared + 1.33 squared), which is about 2.49 days. The 95% range is 14.0 plus or minus 2 times 2.49, or about 9 to 19 days.
The honest message to stakeholders is a 14-day expected finish with a 95% range of about 9 to 19 days, not “two weeks, definitely.”
The backend task drives the range: its SD of 2.0 days is the largest, so cutting its uncertainty helps the project date more than polishing the other two tasks. That is the point of the spread: it shows where to investigate, not just where the time goes.
Tools that help you estimate and track time
A tool helps estimation when it holds the task list, the dates, and the actual hours side by side. The comparison that matters is estimate versus actual, because that gap is what makes the next estimate better. Pick a tool with a timeline or Gantt view so the critical path stays visible.
| Tool | Best for | Free plan | Starting price (as of November 2026) | Notable limit |
|---|---|---|---|---|
| Asana | Timelines with dependencies and time tracking | Free for 2 people | $10.99 per user per month (Starter), billed annually | Time tracking needs Advanced |
| ClickUp | Gantt charts and time tracking in one place | Free Forever plan | $9 per user per month (Core), billed yearly | Paid plans charge per member |
| Wrike | Gantt charts from the first paid plan | Free plan | $10 per user per month (Team), billed annually | Team plan caps at 15 users |
| Trello | Simple boards with a Timeline view | Up to 10 collaborators and 10 boards | $10 per user per month (Premium), billed annually | No native time estimates |
The Asana price comes from Asana pricing: Starter is $10.99 per user per month when billed annually, and Advanced adds native time tracking at $24.99.
The ClickUp price comes from ClickUp pricing: Core is $9 per user per month billed yearly and includes unlimited Gantt charts.
Wrike Team is $10 per user per month billed annually for 2 to 15 users, according to an independent check of the vendor page in October 2026 by Seoraf.
Trello Premium is $10 per user per month billed annually and adds the Timeline view, according to an independent check of the vendor page in October 2026 by Pinateca.
Once the tool holds actual hours, compare them with the estimates each week. Estimating story points uses the same feedback loop for agile teams: the gap between estimate and actual is the training data for the next round. Without that loop, every estimate starts from zero again.
Common estimation mistakes to avoid
Estimation fails in the same five ways, and three-point math cannot save a broken input. Fix the inputs first, then trust the formula.
- Estimating the whole project at once. A single number for a whole project hides every risk inside it. Break the work down first, then estimate task by task.
- Quoting the best case as the estimate. The optimistic time is one input, not the answer. Use the weighted formula so the most likely time carries the weight.
- Asking for O and P before M. The first numbers anchor the rest. Ask for the most likely time first, then expand outward to best and worst cases.
- Hiding the buffer inside tasks. A secret buffer gets spent without anyone noticing. Hold it at the project level where everyone can see it.
- Never checking estimate against actual. An estimate you never compare teaches nothing. Record actual hours next to the estimate and review the gap each week.
Sources
- Rework - Three-Point Estimation (PERT): Formula and Examples (2026)
- Rework - PERT Chart: Definition, How to Make One, and Examples (2026)
- Projeric - Cost Estimation in Project Management: Techniques (2026)
- Mudassir Iqbal - Estimation Techniques: Analogous, Parametric, PERT (2026)
- Asana - Resource Leveling: Techniques, Examples, and Tools (2026)
- Asana - Pricing (2026)
- ClickUp - Pricing (2026)
- Pinateca - Trello Pricing (2026)
- Seoraf - Wrike Pricing 2026 (2026)
Frequently asked questions
What is the most accurate way to estimate project time?
Bottom-up estimation is the most accurate, because you estimate each work package at the lowest level of the work breakdown structure and add the results. It takes the most effort and needs a full task list first. Three-point estimation is the best choice when a task is uncertain, because it gives an expected time plus a range instead of a single number.
What is the PERT formula for estimating time?
The PERT formula is E = (O + 4M + P) / 6, where O is the optimistic time, M is the most likely time, and P is the pessimistic time. The most likely value gets four times the weight of the other two. The standard deviation is SD = (P - O) / 6, and E plus or minus 2 SD gives a 95% confidence range.
How much buffer should I add to a project estimate?
Add a buffer for known risks, not for fear. A common approach is to state the expected time plus a 95% range from three-point estimation, then hold a separate contingency of 10 to 20% of the total for risks you can name. Keep the buffer visible as its own line so the team and the client can see what is work and what is cover.
Why do project time estimates always seem too short?
Single-point estimates invite optimism bias: people quote the time if everything goes right and forget meetings, reviews, and rework. Three-point estimation fixes this by forcing a pessimistic value into the math. Estimates also fail when tasks are too big to judge, so split work into tasks of half a day to two weeks before you estimate.
When should I use analogous estimation?
Use analogous estimation early, when you have little detail but a similar past project to compare against. It is fast and cheap, but it is the least accurate of the four techniques, because no two projects match exactly. Move to parametric or bottom-up estimation once the scope is clear enough to price the actual work.
Related articles

project management
How to Choose Project Management Software (2026)
Pick project management software in seven steps: define the work, count seats, price the real cost, and run a two-week pilot before you pay.
November 19, 2026 · 10 min read

project management
What Is a RACI Matrix? Definition, Roles and Examples (2026)
A RACI matrix maps who is Responsible, Accountable, Consulted and Informed for each task. Learn the four roles, how to build one, and see a worked example.
November 19, 2026 · 9 min read
project management
Daily Standup Meeting Format That Works (2026)
A daily standup is a 15-minute meeting where Developers inspect progress toward the Sprint Goal and plan the next day. Use this format to run one that ends on time.
November 19, 2026 · 10 min read