30 Remote Work Statistics for 2026 | The Collaborative Organization
By The Collaborative Organization Team · November 19, 2026 · Last verified November 19, 2026 · 14 min read
This list brings together 30 remote work statistics from Gallup, Pew, Owl Labs, FlexJobs, Cisco, the Bureau of Labor Statistics, and two randomized trials. Every figure names its source and year, and every number links to the original study in the body.
Key takeaways
- About 25 percent of all paid workdays in the United States were done from home in November 2025, and the share has held steady since 2023.
- Among remote-capable workers, 51 percent work hybrid, 28 percent work exclusively remote, and 21 percent work on-site, according to Gallup in 2025.
- 76 percent of workers would look for a new job if forced back to the office full-time, according to FlexJobs in 2025.
- A randomized trial of 1,612 employees found hybrid work cut resignations by 33 percent with no effect on performance or promotions.
- Employers save about $11,000 a year per half-time remote employee, according to Global Workplace Analytics.
How we chose these 30 statistics
We picked statistics from original studies and official data, not from lists that copy other lists. Each figure below comes from the organization that measured it: a government survey, a research institute, a peer-reviewed trial, or a named survey with a stated sample. Where a figure comes from a summary rather than the original page, the notes at the end of this article say so, and the linked page is the closest reputable source we could open.
We grouped the figures by theme: adoption, preference, productivity, wellbeing, and costs. Within each theme, the figures come from different years and different populations, so read the source and year with each number before you compare two figures. A survey of remote-capable workers and a survey of all workers measure different groups, and their percentages will not match.
We dropped figures we could not trace to a published study, and we dropped figures whose only source was an aggregator page. The table at the end lists all 30 statistics with source and year, so you can check any figure in seconds.
Remote work adoption statistics
Remote work stopped growing and started lasting: about a quarter of all paid workdays in the United States now happen at home. The adoption figures below come from five different measures, and they agree on the same story.
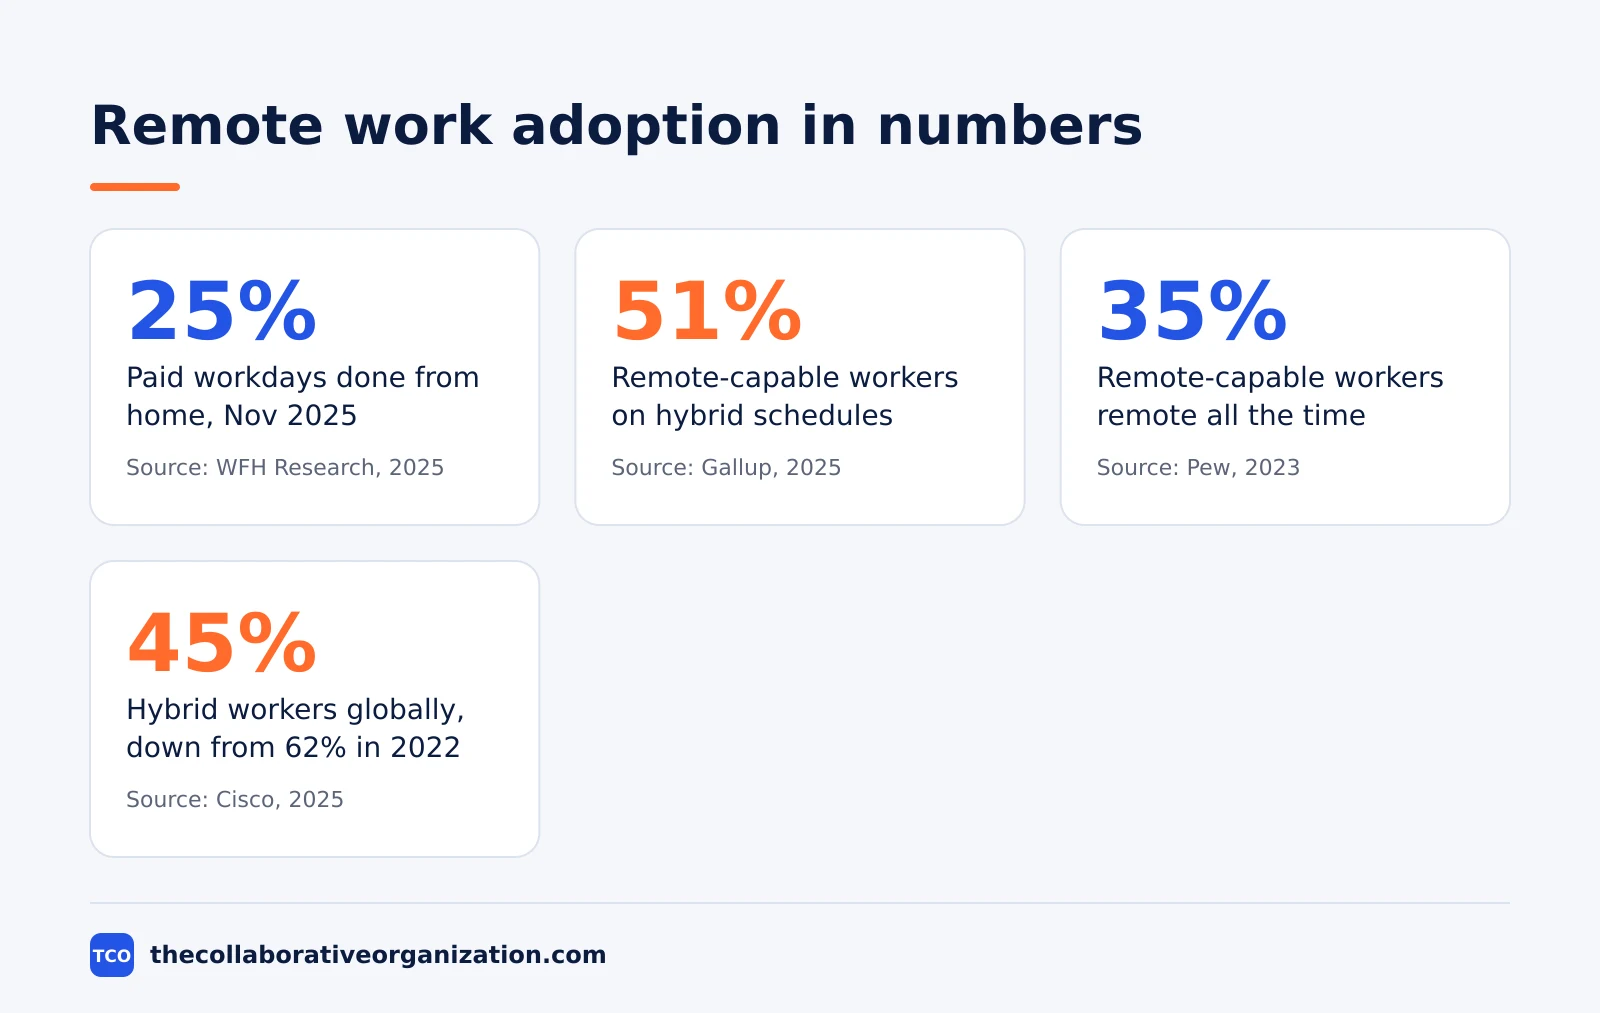
About 25 percent of paid days in the United States in November 2025 were work-from-home days, according to WFH Research and its monthly Survey of Working Arrangements and Attitudes, which has run since May 2020 with more than 200,000 responses to date.
The same share appears in academic work: working from home stabilized at about 25 percent of all paid workdays as of 2025, about 3.5 times its 2019 level, according to the National Bureau of Economic Research working paper by Barrero, Bloom, and Davis.
The Bureau of Labor Statistics tells the same story from time diaries: 35 percent of employed people did some or all of their work at home on days they worked in 2025, and 70 percent did some or all of it at their workplace.
The gap is wider by education: 51 percent of workers with a bachelor’s degree or higher did some work at home, against 19 percent of those with a high school diploma and no college. All three figures come from the Bureau of Labor Statistics American Time Use Survey results released in June 2026.
Gallup narrows the lens to workers whose jobs can be done remotely, about half of the total United States workforce. In May 2025, 51 percent of that group worked hybrid, 28 percent worked exclusively remote, and 21 percent worked on-site, according to Gallup.
Pew Research Center found a similar split in 2023: 35 percent of workers with jobs that can be done from home worked from home all the time, and 41 percent worked hybrid. About 14 percent of all employed adults in the United States, about 22 million people, worked from home all the time, according to Pew Research Center.
Pew’s later survey, run in October 2024 and published in February 2025, found 32 percent of remote-capable workers working remotely all the time, and 43 percent working from home most or some of the time, up from 23 percent before the pandemic, according to Pew Research Center.
Vendor surveys of full-time workers give lower remote shares, because they count all workers rather than remote-capable ones. Owl Labs found 28 percent hybrid, 9 percent fully remote, and 63 percent fully in-office among United States full-time workers in 2025, in a survey of 2,000 people, according to Owl Labs.
Globally, Cisco found 45 percent hybrid in 2025, down from 62 percent in 2022, with 49 percent fully on-site and 6 percent fully remote, in a survey of 21,513 employers and employees across 21 markets, according to Cisco.
Remote work preference statistics
Workers want remote work more than they want a raise, and they act on that preference when employers take it away. The preference figures below come from job-seeker surveys, not from employers.
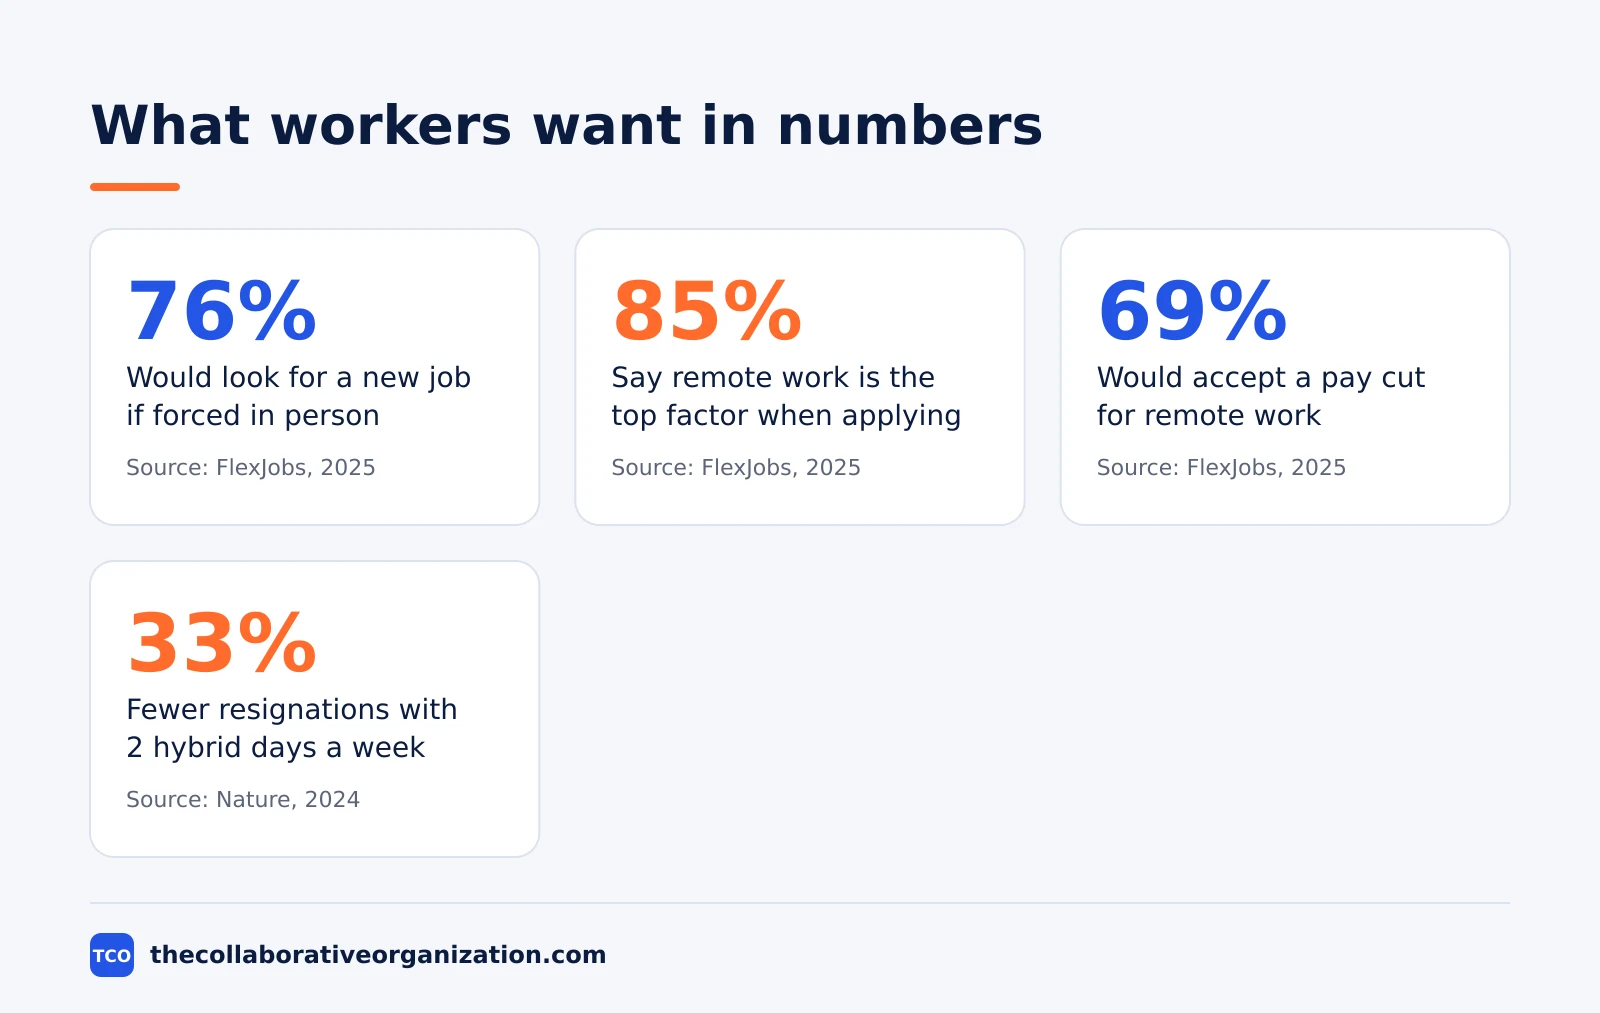
76 percent of workers would look for a new job if their employer required them to work fully in person, up from 57 percent the year before, in FlexJobs’ 2025 State of the Workforce Report, a survey of more than 3,000 United States professionals run in August 2025, according to FlexJobs.
The same survey found 85 percent of respondents say remote work is the top factor when applying for a job, ahead of a competitive salary and benefits package at 72 percent, and 69 percent would accept a pay cut for remote work.
When asked what they want, 58 percent said fully remote, 40 percent said hybrid, and 2 percent said in-office.
An earlier FlexJobs report, published in December 2024, found 81 percent of respondents said remote work is the factor they consider most important in a job, followed by salary at 77 percent and a flexible schedule at 72 percent, according to FlexJobs.
Cisco’s global survey agrees from the employer side: 63 percent of respondents would accept a pay cut for the option to work remotely more often, according to Cisco.
Remote work productivity statistics
The strongest evidence on productivity comes from randomized trials, and it favors hybrid over both extremes. The figures below separate trials from surveys, because the two kinds of evidence are not equal.
A randomized trial of 1,612 employees at Trip.com found hybrid work had no effect on performance grades or promotions, while resignations fell by 33 percent, from 7.2 percent to 4.8 percent.
The trial ran for six months with two home days a week, and the paper appeared in Nature in 2024, according to the Nature study by Bloom, Han, and Liang.
An earlier trial tested fully remote work rather than hybrid: 249 call-center volunteers at Ctrip worked from home for nine months, and performance rose 13 percent, while attrition fell to 17.0 percent at home against 35.0 percent in the office. The trial appeared in the Quarterly Journal of Economics in 2015, and the figures are described in detail by EmailAnalytics.
Surveys of managers point the same way, with weaker evidence. 69 percent of managers say hybrid and remote work has made their team more productive, in Owl Labs’ 2025 survey of 2,000 United States full-time workers, according to Owl Labs.
Cisco found the same pattern from the top of the performance range: 50 percent of high performers work for organizations requiring less than three days in the office per week, according to Cisco.
Clear goals matter more than location. Teams with clear, trackable goals are 20 percent more effective, according to Atlassian’s Teamwork Lab in its State of Teams 2025 report, a survey of 12,000 knowledge workers and 200 executives, according to Atlassian.
Microsoft’s Work Trend Index 2025, a survey of 31,000 workers across 31 countries, found 80 percent of employees say they do not have enough time or energy to do their work, while 53 percent of leaders say productivity must increase, according to Microsoft.
The same Owl Labs survey found 80 percent of employees have experimented with AI at work, a 45 percent increase from March 2025, as workers use AI to reclaim time lost to commutes and meeting setup.
Remote work wellbeing and cost statistics
Remote work engages people and isolates them at the same time, and it saves money on both sides of the employment deal. The figures below cover both halves of that trade.
Fully remote workers are the most engaged group and the least likely to be thriving: 31 percent engaged, against 23 percent for hybrid and on-site workers, but 36 percent thriving, against 42 percent for the other two groups.
27 percent felt lonely the previous day, against 20 percent of on-site workers who could work remotely, according to Gallup and its State of the Global Workplace 2025.
The balance of work and life is where remote work wins most clearly. 71 percent of teleworkers say working from home helps them balance work and personal life, and 56 percent say it helps them get work done and meet deadlines, according to Pew Research Center.
Office work has its own wellbeing cost: 46 percent of full-time office workers report feeling disengaged, against 30 percent of remote employees, according to Owl Labs.
The money figures come from one model, so read them as estimates rather than counts. A typical employer saves about $11,000 per year for each person who works remotely half the time, and the total saving across the United States would pass $700 billion a year if remote-capable staff worked from home half the time.
The employee saves $2,000 to $7,000 a year working from home half the time, according to Global Workplace Analytics.
What the numbers mean
Remote work has settled into a stable split, and the fight now is over who decides the schedule, not whether remote work survives. The adoption figures barely moved between 2023 and 2025, even as return-to-office mandates made headlines, and the preference figures moved the other way: workers want flexibility more, not less.
The productivity evidence is the part most people get wrong. Hybrid schedules of two home days a week match office output and cut resignations by a third, while fully remote work helps some roles and hurts others.
A team that judges remote work by a single survey number will miss that split, and our comparison of remote vs hybrid vs office work sets the three models side by side.
The wellbeing figures are the warning inside the good news. Remote workers engage more and thrive less, and loneliness runs higher for fully remote workers than for anyone else.
A remote policy that ignores that trade will keep its people and lose their health, and the fix is deliberate contact: regular video socials, written updates, and occasional in-person meetups. Our guide on how to choose team communication software covers the tools that carry that contact.
All 30 remote work statistics at a glance
Every statistic in this article, with its source and year, in one table. Use it to check a figure before you quote it.
| # | Statistic | Source | Year |
|---|---|---|---|
| 1 | About 25% of paid workdays in the US were work-from-home days in November 2025 | WFH Research | 2025 |
| 2 | Work from home stabilized at about 25% of all paid workdays, 3.5 times the 2019 level | NBER | 2025 |
| 3 | 35% of employed people did some or all of their work at home on days they worked | BLS ATUS | 2025 |
| 4 | 70% of employed people did some or all of their work at their workplace | BLS ATUS | 2025 |
| 5 | 51% of workers with a bachelor’s degree or higher did some work at home, vs 19% with high school only | BLS ATUS | 2025 |
| 6 | Remote-capable workers are about half of the total US workforce | Gallup | 2025 |
| 7 | 51% hybrid, 28% exclusively remote, 21% on-site among remote-capable US employees | Gallup | 2025 |
| 8 | 35% of remote-capable workers worked from home all the time, 41% hybrid; 14% of all employed adults all the time | Pew | 2023 |
| 9 | 32% of remote-capable workers worked remotely all the time; 43% most or some of the time | Pew | 2025 |
| 10 | 28% hybrid, 9% fully remote, 63% fully in-office among US full-time workers | Owl Labs | 2025 |
| 11 | 45% hybrid globally, down from 62% in 2022; 49% fully on-site, 6% fully remote | Cisco | 2025 |
| 12 | 76% would look for a new job if forced fully in person, up from 57% | FlexJobs | 2025 |
| 13 | 85% say remote work is the top factor when applying for a job, ahead of salary and benefits at 72% | FlexJobs | 2025 |
| 14 | 69% would accept a pay cut for remote work | FlexJobs | 2025 |
| 15 | 58% want fully remote, 40% hybrid, 2% in-office | FlexJobs | 2025 |
| 16 | 81% say remote work is the most important factor in a job, salary 77% | FlexJobs | 2024 |
| 17 | 63% would accept a pay cut to work remotely more often | Cisco | 2025 |
| 18 | Hybrid 2 days home: no effect on performance or promotions; resignations down 33% | Nature | 2024 |
| 19 | Fully remote call-center trial: performance up 13%; attrition 17.0% home vs 35.0% office | QJE | 2015 |
| 20 | 69% of managers say hybrid and remote work made their team more productive | Owl Labs | 2025 |
| 21 | 50% of high performers work for organizations requiring less than 3 office days a week | Cisco | 2025 |
| 22 | Teams with clear, trackable goals are 20% more effective | Atlassian | 2025 |
| 23 | 80% of employees lack the time or energy to do their work; 53% of leaders say productivity must rise | Microsoft | 2025 |
| 24 | 80% of employees have experimented with AI at work | Owl Labs | 2025 |
| 25 | Fully remote 31% engaged vs 23% hybrid and on-site; 36% thriving vs 42% | Gallup | 2025 |
| 26 | 27% of fully remote workers felt lonely the previous day, vs 20% of on-site remote-capable workers | Gallup | 2025 |
| 27 | 71% of teleworkers say working from home helps balance work and personal life; 56% say it helps meet deadlines | Pew | 2025 |
| 28 | 46% of full-time office workers feel disengaged, vs 30% of remote employees | Owl Labs | 2025 |
| 29 | Employer saves about $11,000 a year per half-time remote employee; over $700 billion a year US potential | Global Workplace Analytics | 2025 |
| 30 | Employee saves $2,000 to $7,000 a year working from home half the time | Global Workplace Analytics | 2025 |
Common remote work statistics mistakes to avoid
Most bad statistics about remote work come from mixing up measures, not from making up numbers. The five mistakes below cause most of the confusion.
- Comparing a share of days with a share of people. WFH Research counts paid days, Gallup counts remote-capable workers, and the Bureau of Labor Statistics counts people on days they worked. The numbers will not match, and that is not a contradiction.
- Quoting a vendor survey as if it were official data. A survey of 2,000 workers is useful, but it is not the same as a government survey, and it should be labeled as what it is.
- Using a 2020 figure for a 2026 decision. Remote work in 2020 was a crisis measure, and the figures from that year describe a lockdown, not a choice.
- Treating preference as proof of productivity. Workers prefer remote work, and that preference is real, but it does not prove they produce more. The trials prove that part, not the surveys.
- Hiding the sample. A statistic without a sample size, a year, and a population is a slogan. Every figure in this list carries all three, and any figure you quote should too.
When you act on these numbers, start with the trial evidence and the official data, then use the surveys to understand what workers want. Our guide on how to run a hybrid meeting shows one place where the numbers turn into practice.
The team communication software shortlist covers the tools that carry remote work day to day.
Sources
- WFH Research - SWAA December 2025 Updates (2025)
- NBER - Why Working from Home Will Stick (2025)
- Bureau of Labor Statistics - American Time Use Survey, 2025 Results (2026)
- Gallup - Hybrid Work in Retreat? Barely. (2025)
- Pew Research Center - About a Third of U.S. Workers Who Can Work from Home Do So All the Time (2023)
- Pew Research Center - 5 Years Later: America Looks Back at the Impact of COVID-19 (2025)
- Owl Labs - State of Hybrid Work 2025 (2025)
- FlexJobs - 2025 State of the Workforce Report (2025)
- Cisco - Global Hybrid Work Study 2025 (2025)
- Gallup - State of the Global Workplace 2025 (2025)
Frequently asked questions
How many people work remotely in the United States?
About 25 percent of all paid workdays in the United States were done from home in November 2025, according to WFH Research. Among workers whose jobs can be done remotely, Gallup found 51 percent hybrid, 28 percent exclusively remote, and 21 percent on-site in May 2025. Pew found 35 percent of remote-capable workers worked from home all the time in 2023.
What percentage of workers prefer remote work?
Most workers want some remote time. FlexJobs found 58 percent want fully remote work, 40 percent want hybrid, and only 2 percent want full-time office work. In the same survey, 76 percent said they would look for a new job if forced back to the office full-time. The preference for hybrid over full-time office work is the most consistent finding across surveys.
Is remote work more productive than office work?
The strongest evidence says hybrid work matches office productivity, while fully remote work is mixed. A randomized trial of 1,612 Trip.com employees found hybrid workers were just as productive and just as likely to be promoted, with resignations down 33 percent. A 2015 call-center trial found fully remote workers 13 percent more productive. Self-reported surveys are less reliable than these trials.
What is the biggest challenge of remote work?
Loneliness and weak social ties are the most reported challenge. Gallup found 27 percent of fully remote workers felt lonely the previous day, against 20 percent of on-site workers who could work remotely. Remote workers also report less mentoring and fewer casual conversations. Regular video socials, occasional in-person meetups, and written updates help, but they do not fully replace office contact.
How much money does remote work save?
Global Workplace Analytics estimates a typical employer saves about 11,000 dollars per year for each person who works remotely half the time, mostly from real estate, absenteeism, and turnover. The same model puts the saving for the employee at 2,000 to 7,000 dollars a year from commuting, food, and clothing. Across the whole United States, the potential saving is over 700 billion dollars a year.
Related articles

team communication
Communication Plan for a Project: Template (2026)
A communication plan for a project names who gets which update, in which channel, how often, and from whom. Copy the template and the filled example below.
November 20, 2026 · 10 min read

team communication
How Often Should Managers Communicate With Teams? (2026)
Managers should hold one meaningful conversation with each person every week, plus a weekly team update. See the cadence table for meetings, updates and feedback.
November 20, 2026 · 9 min read

team communication
Upward Communication Examples: 10 That Work (2026)
Upward communication is a message that travels from an employee to a manager or leader. See 10 concrete examples, each with why it works and when to use it.
November 20, 2026 · 9 min read