Project Management Software Statistics: 30 Stats (2026) | The Collaborative Organization
By The Collaborative Organization Team · November 19, 2026 · Last verified November 19, 2026 · 10 min read
Project management software is a $9.76 billion market in 2025, yet only 38% of organisations mostly or always finish projects on time. The market figure comes from Mordor Intelligence, and the delivery figure from Wellingtone’s 2025 survey. The 30 statistics below cover market size, adoption, delivery, methods and AI, each with its source and year.
Key takeaways
- The project management software market is worth $9.76 billion in 2025, per Mordor Intelligence.
- Only 38% of organisations mostly or always finish projects on time, per Wellingtone in 2025.
- PMI found 48% of projects successful in 2024 and 50% in 2025, under its value-based definition.
- AI use in software delivery rose from 68% to 84% in a year, per Digital.ai in 2025.
- Asana Starter costs $10.99 per user per month billed annually, and ClickUp Core costs $9, as of November 2026.
How we chose these 30 statistics
We picked statistics from named studies published in 2024, 2025 and 2026, and we dropped any figure we could not trace to a published source. Each number below names its study and year, and the table at the end repeats all 30 with links. Older landmark studies are included only where no newer figure exists, and their year is stated.
Two notes on sourcing. The Standish CHAOS figures come from a published summary because the full report sits behind a paywall. The Wellingtone figures come from Wellingtone’s own report, via its parent company Xergy’s summary and the full report PDF.
Prices in the tools table come from the vendors’ own pricing pages opened on 19 November 2026. The monday.com page showed no dollar figures on that date, so its row says so instead of guessing a price.
Adoption and market size
The market keeps growing: Mordor Intelligence puts project management software at $9.76 billion in 2025. The same Mordor Intelligence forecast grows the market at 15.65% a year to $20.20 billion by 2030. Cloud deployment held 75% of 2024 revenue, and North America held 36.5% of the market.
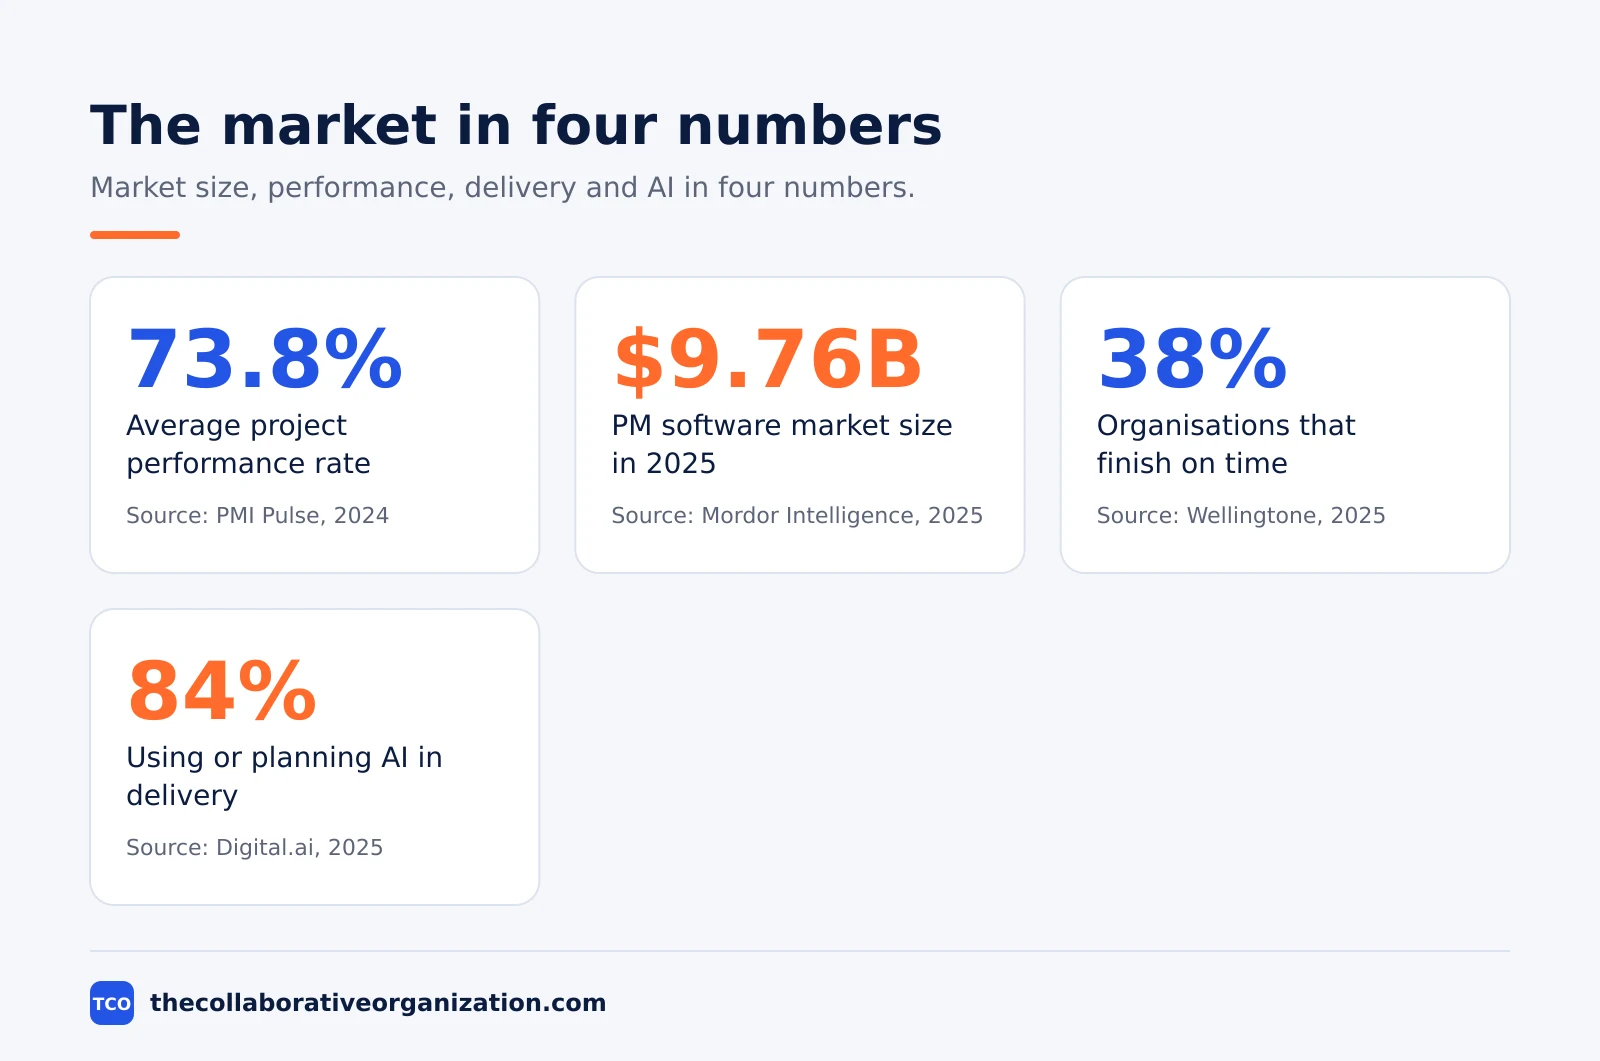
Most teams now mix methods instead of following one by the book. Digital.ai found 74% of organisations use hybrid or homegrown Agile models in its 2025 report, and SAFe adoption rebounded to 44%. Only 13% of respondents said Agile is deeply embedded across their business.
Hybrid is the direction of travel. PMI’s Pulse of the Profession 2024 found hybrid approaches rose from 20% of projects in 2020 to 31% in 2023. The project management statistics guide covers the method mix in more depth.
Delivery outcomes: what the software has to fix
About half of projects succeed when success means value delivered. PMI asked nearly 10,000 people in 139 countries in 2024 and found 48% successful, 40% mixed and 12% outright failures, for a Net Project Success Score of 36. PMI published the definition and the figures in September 2024.
The 2025 survey barely moved. PMI’s 2025 study of 5,842 professionals found 50% successful, 37% mixed and 13% failures, for a score of 37. The PMI 2025 report shows the new definition holding steady year to year.
Older measures tell a harsher story. The Standish Group’s CHAOS Report 2020 found 31% of software projects fully successful, 50% challenged and 19% failed outright. The full report is paywalled, so these figures come from a published summary of the report.
Size matters more than method. In the CHAOS 2015 data, small projects succeeded 61% of the time while the largest projects succeeded only 6% of the time, with failure rates of 7% and 43%. The size breakdown comes from a page that read the figures from the primary report.
Megaprojects do worst of all. Bent Flyvbjerg’s database of more than 16,000 projects in 136 countries found only 8.5% came in on budget and on time, and just 0.5% also delivered the promised benefits. The figures are quoted in a New Civil Engineer interview with Flyvbjerg. Our project failure rate statistics guide puts these rates beside newer data.
Time, budget and benefits
Most organisations struggle to finish on time, on budget and with the full benefits promised. Wellingtone’s 2025 survey found only 38% of organisations mostly or always complete projects on time, and 41% mostly or always finish within budget. Benefits are the weakest link: just 39% mostly or always deliver the full benefits.
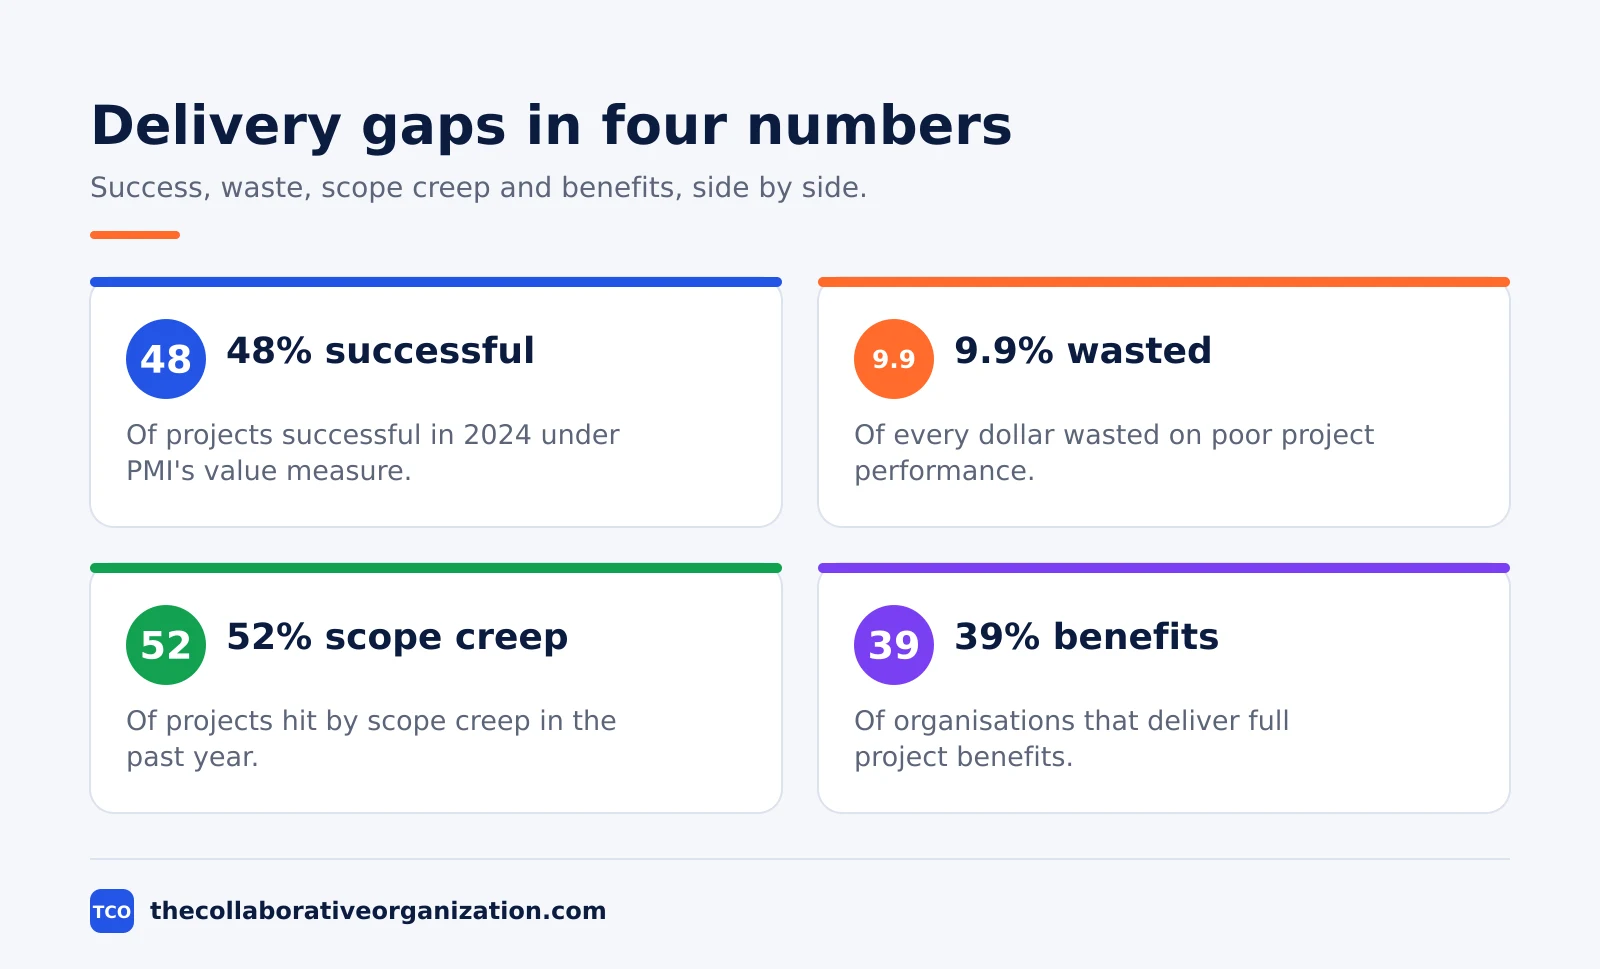
Waste is the cost of weak delivery. PMI’s Pulse of the Profession 2018 found 9.9% of every dollar is wasted due to poor project performance, which is $99 million for every $1 billion invested. The same survey found 52% of projects had uncontrolled scope changes in the past year. PMI’s 2018 report states both figures.
Reporting still eats time. Wellingtone found 42% of project professionals spend one or more days each month collating reports by hand, and about half of organisations have no access to real-time KPIs. The Wellingtone 2025 findings also show 40% naming resource management as their biggest challenge.
Large IT projects overrun badly. McKinsey and Oxford studied more than 5,400 large IT projects and found they ran 45% over budget and 7% over time on average, delivering 56% less value than predicted. The McKinsey on Finance article that published the study states all three figures.
AI inside project tools
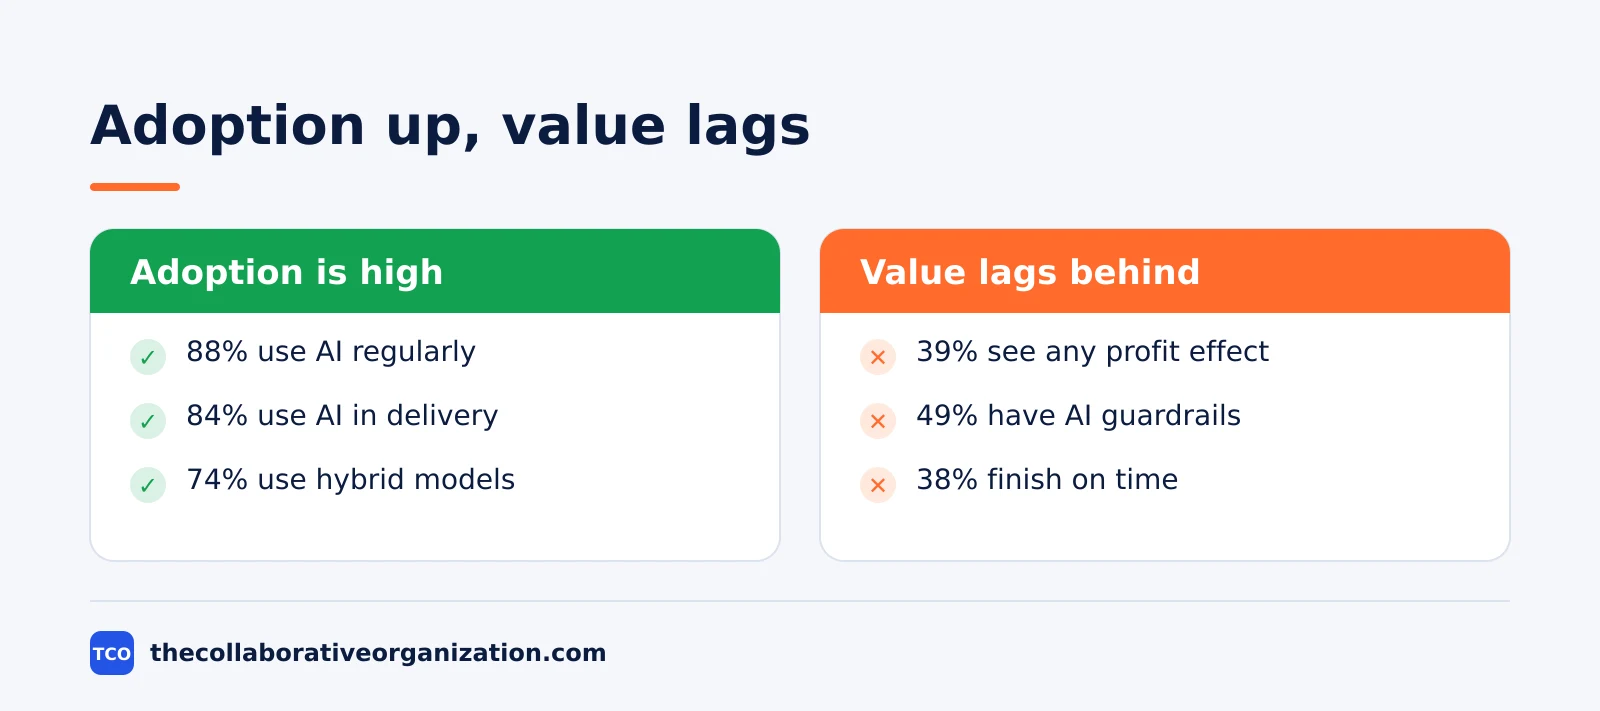
AI moved from experiment to standard practice in a single year. Digital.ai found AI adoption in software delivery rose from 68% to 84% between its 2024 and 2025 reports, but only 49% of respondents have governance guardrails for AI in delivery. Adoption is outrunning oversight by 35 points.
The same gap shows across the economy. McKinsey found 88% of organisations regularly use AI in at least one function in 2025, yet only 39% report any enterprise-level effect on profit, and only 7% have fully scaled AI. Just 21% of adopters had fundamentally redesigned any workflow.
Daily users see the clearest gains. Slack’s Workforce Index found desk workers who use AI daily report 64% higher productivity and 81% greater job satisfaction than colleagues who do not use AI. The lesson for tool buyers is to ask what the AI does inside the workflow, not whether the box is ticked.
Business acumen is rare and it pays. PMI found only 18% of project professionals show high business acumen, while 66% sit at a moderate level. The Pulse of the Profession 2025 report puts the failure rate at 8% for high-acumen professionals, against 11% for lower proficiency.
Tools and starting prices
Three of the most used tools cover most small-team needs, and their starting prices are far apart. The table below uses prices from each vendor’s own pricing page, opened on 19 November 2026. Compare the full field on our project management software shortlist before you buy.
| Tool | Best for | Free plan | Starting price (as of November 2026) | Notable limit |
|---|---|---|---|---|
| Asana | Teams that want every task to have a named owner | Free for 2 people | $10.99 per user per month, billed annually | Free plan covers 2 people |
| monday.com | Teams that want a visual board with phases and status | Free plan for up to 2 seats | No dollar figure on the pricing page as of November 2026 | Paid plans need at least 3 seats |
| ClickUp | Teams that want custom fields and built-in docs | Free Forever plan | $9 per user per month (Core), billed annually | $9 is against a $12 regular price |
The Asana price comes from Asana pricing: Starter is $10.99 per user per month when billed annually, and Advanced is $24.99.
The ClickUp pricing page lists Core at $9 per user per month billed yearly, against a $12 regular price, and Business at $17.
The monday.com pricing page showed no dollar figures when opened on 19 November 2026, only plan names and an FAQ, so no monday.com price appears here.
The 30 project management software statistics in one table
The table below lists all 30 statistics with their source and year. Figures that describe a subgroup say so in the statistic itself.
| Statistic | Source | Year |
|---|---|---|
| $9.76 billion market size in 2025 | Mordor Intelligence | 2025 |
| 15.65% CAGR to $20.20 billion by 2030 | Mordor Intelligence | 2025 |
| 75% of 2024 revenue from cloud deployment | Mordor Intelligence | 2025 |
| 74% use hybrid or homegrown Agile models | Digital.ai | 2025 |
| SAFe adoption at 44% | Digital.ai | 2025 |
| 84% using or planning AI in delivery (from 68%) | Digital.ai | 2025 |
| 49% have AI governance guardrails | Digital.ai | 2025 |
| 13% say Agile is deeply embedded | Digital.ai | 2025 |
| 73.8% average project performance rate | PMI Pulse | 2024 |
| 48% successful, 40% mixed, 12% failures | PMI | 2024 |
| 50% successful, 37% mixed, 13% failures | PMI | 2025 |
| 9.9% of every dollar wasted on poor performance | PMI Pulse | 2018 |
| 52% of projects experienced scope creep | PMI Pulse | 2018 |
| 31% successful, 50% challenged, 19% failed (CHAOS 2020) | Standish Group | 2020 |
| 91.5% over budget, over schedule, or both | Flyvbjerg | 2023 |
| Large IT projects 45% over budget, 7% over time | McKinsey and Oxford | 2012 |
| 38% mostly or always finish on time | Wellingtone | 2025 |
| 41% mostly or always finish on budget | Wellingtone | 2025 |
| 39% mostly or always deliver full benefits | Wellingtone | 2025 |
| 21% of teams rely on spreadsheets | Wellingtone | 2025 |
| 11% of organisations have no PM solution | Wellingtone | 2025 |
| 42% spend 1+ day a month collating reports by hand | Wellingtone | 2025 |
| 46% dissatisfied with PM maturity | Wellingtone | 2025 |
| 89% have one or more PMOs | Wellingtone | 2025 |
| 40% name resource management as biggest challenge | Wellingtone | 2025 |
| 18% show high business acumen | PMI | 2025 |
| 8% failure rate for high-acumen vs 11% for lower | PMI | 2025 |
| 88% of organisations regularly use AI | McKinsey | 2025 |
| 60% of time goes to “work about work” | Asana | 2026 |
| Daily AI users report 64% higher productivity | Slack | 2025 |
What the numbers mean for your team
The numbers point the same way: software is widely bought, delivery is still weak, and the gaps are in measurement, benefits and reporting. Teams that measure success, track benefits and cut manual reporting get more from the same tools than teams that only buy seats.
Worked example: a 200-person team buys Asana Starter
Take a 200-person team. At $10.99 per user per month billed annually, Asana Starter costs about $2,198 a month, or $26,376 a year. If the team cuts the 42% reporting burden by one day a month per person, it frees about 200 working days a month. The arithmetic is an illustration from the published figures, not a promise.
Pick the tool after the workflow, not before it. Our how to choose project management software guide covers seat counts, free-plan caps and the questions to ask in a trial.
Common project management software statistics mistakes to avoid
Most bad takes on these numbers come from the same five errors, and all five are easy to avoid.
- Quoting the 31% CHAOS success rate as today’s rate. It comes from the 2020 report, and PMI’s newer value-based measure gives 48 to 50%.
- Treating market size as adoption. A $9.76 billion market does not mean most teams use PM software well; 21% still run projects on spreadsheets.
- Reading the 84% AI figure as AI value. Digital.ai counted use or planned use, while only 49% have governance guardrails.
- Using a monday.com $9 figure from memory. The pricing page showed no dollar figures on 19 November 2026, so check the page before you quote a price.
- Comparing headline prices without the billing basis. Asana’s $10.99 is billed annually; the monthly rate is $13.49, and ClickUp’s $9 sits against a $12 regular price.
Sources
- Mordor Intelligence - Project Management Software Market (2025)
- Digital.ai - 18th State of Agile Report (2025)
- PMI - Pulse of the Profession 2024 (2024)
- PMI - Reframing Project Success (2024)
- PMI - Maximizing Project Success 2025 (2025)
- PMI - Pulse of the Profession 2025 (2025)
- PMI - Pulse of the Profession 2018 (2018)
- Wellingtone - State of Project Management 2025 (2025)
- McKinsey - Delivering large-scale IT projects on time, on budget, and on value (2012)
- McKinsey - The State of AI in 2025 (2025)
Frequently asked questions
How big is the project management software market?
Mordor Intelligence puts the market at $9.76 billion in 2025, growing at 15.65% a year to $20.20 billion by 2030. Cloud deployment held 75% of 2024 revenue, and North America held 36.5% of the market in 2024.
What percentage of projects succeed?
PMI found 48% of projects successful in 2024 and 50% in 2025, using a value-based definition of success. Older measures based only on time and budget give lower rates: the Standish CHAOS Report 2020 found 31% of software projects fully successful.
Do most organisations use project management software?
Not all of them. Wellingtone found 21% of project teams still rely on spreadsheets to run projects in 2025, and 11% of organisations have no project management solution at all. Most do have a PMO: 89% of organisations have one or more.
How much does project management software cost?
Asana Starter costs $10.99 per user per month billed annually, and ClickUp Core costs $9 per user per month billed yearly, against a $12 regular price, as of November 2026. The monday.com pricing page showed no dollar figures when opened on 19 November 2026.
Is AI widely used in project management?
Yes, and use is rising fast. Digital.ai found AI adoption in software delivery rose from 68% to 84% between its 2024 and 2025 reports. Only 49% of respondents have governance guardrails for AI, so oversight lags behind adoption.
Related articles
guides
Free Project Management Templates: 7 to Copy (2026)
Seven free project management templates from monday, Wrike, Teamwork, Smartsheet, ClickUp, Asana and Trello, with what each one is for and what free really costs.
November 20, 2026 · 7 min read
guides
Project Proposal Template: Copy and Win Work (2026)
A project proposal template pitches the work before it is approved: problem, solution, scope, budget, timeline and terms. Copy the template and filled example.
November 20, 2026 · 10 min read
guides
Action Plan Template: Goal to Done in One Page (2026)
An action plan template turns one goal into owned steps with dates, dependencies and a success measure. Copy the table and see it filled for a support team.
November 20, 2026 · 11 min read