Project Failure Rate Statistics (2026) | The Collaborative Organization
By The Collaborative Organization Team · November 19, 2026 · Last verified November 19, 2026 · 11 min read
Project failure rates run from 12% to 19% on the common measures, and far higher on strict ones: only 0.5% of large projects hit budget, time and promised benefits together. The rate depends on who counts, what counts as failure, and how big the project is.
Key takeaways
- PMI found 13% of projects failed outright in 2025, with 37% partly delivering and 50% succeeding.
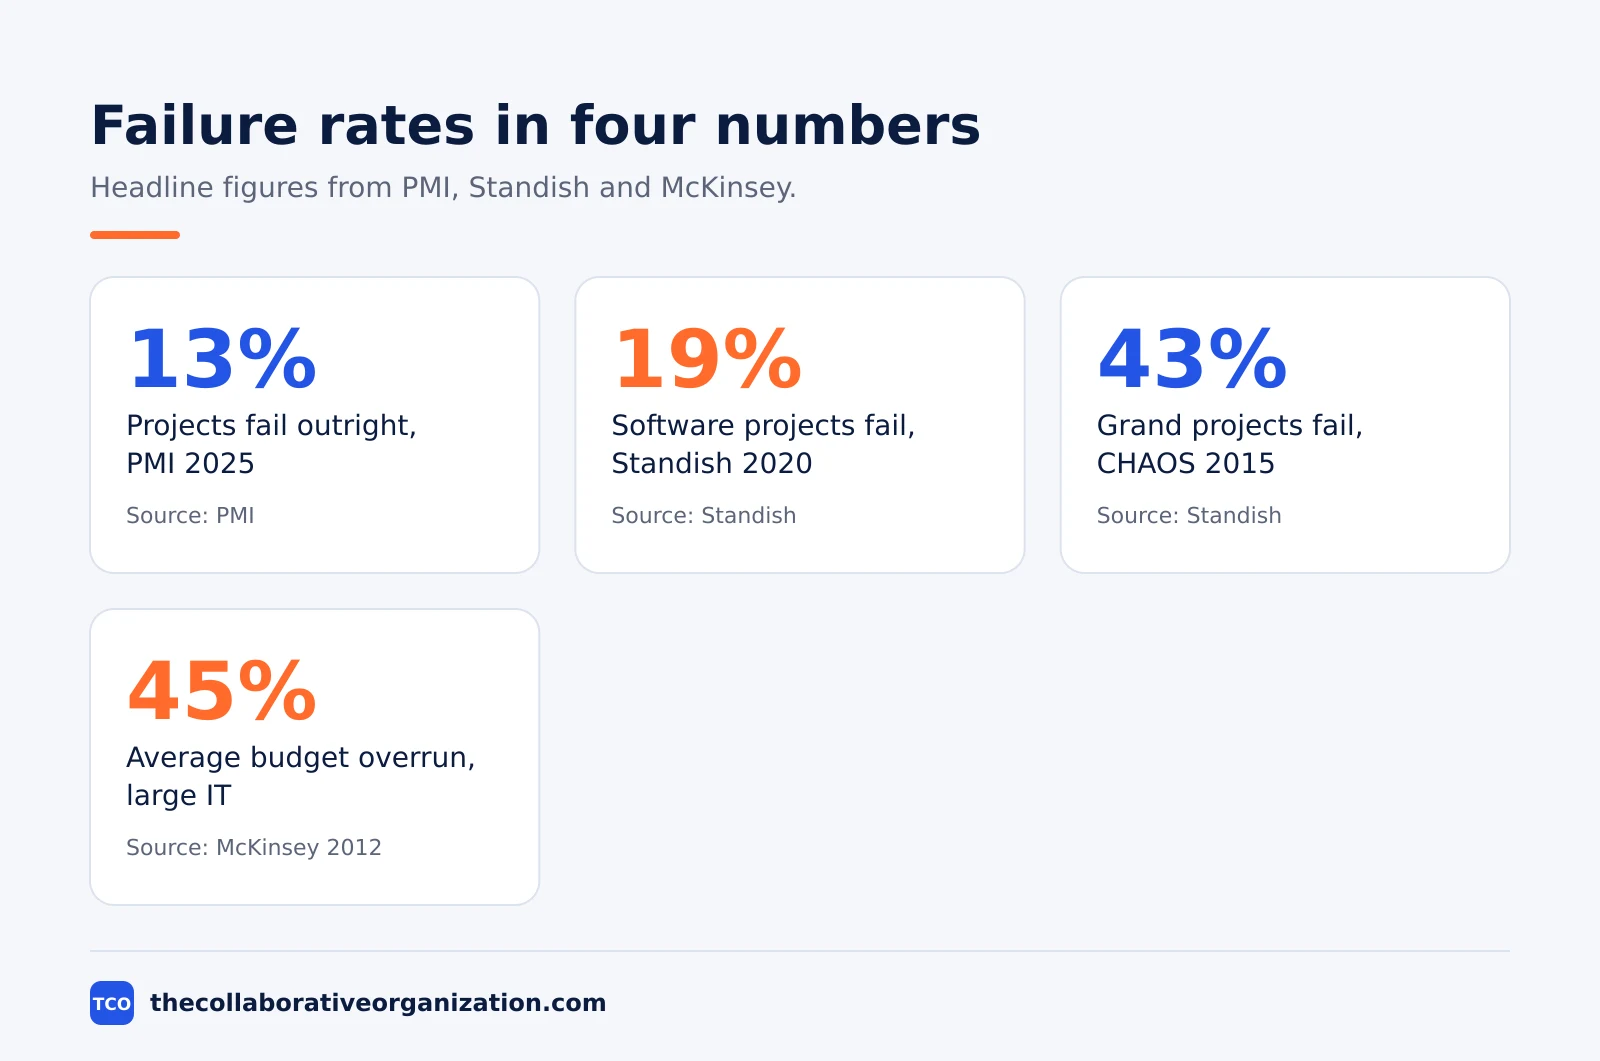
- Standish found 19% of software projects failed in 2020, with 50% challenged and 31% successful.
- Large projects fail far more: in 2015 data, grand projects failed 43% of the time against 7% for small ones.
- The top failure cause in PMI’s 2018 survey was a change in the organisation’s priorities, named by 39%.
- PMI found 9.9% of every dollar invested is wasted on poor project performance, or $99 million per $1 billion.
How often projects fail: the headline rates
The most quoted failure rates come from PMI and Standish, and they measure different things. Read the definition before you quote the number. The project management process behind these numbers runs from initiation to closeout.
PMI’s newest measure counts value, not dates. In its 2024 study of nearly 10,000 people in 139 countries, 48% of projects delivered value worth the effort and expense, 40% gave mixed results and 12% were outright failures. PMI turned those shares into a Net Project Success Score of 36.
The 2025 survey moved only slightly. PMI’s 2025 study of 5,842 project professionals found 50% successful, 37% mixed and 13% failures, for a Net Project Success Score of 37. The PMI 2025 report shows the value-based measure is stable year to year.
Standish counts software projects on time, budget and scope. Its CHAOS Report 2020, the final edition of the long-running study, found 31% of software projects fully successful, 50% challenged and 19% failed outright. The report is paid, so the figures here come from a published summary of the report.
The long trend is slow improvement. In the original 1994 CHAOS survey, only 16.2% of projects succeeded and 31.1% were cancelled before completion. By 2020 the failure share had fallen to 19%, per the same CHAOS summary.
An older PMI measure gave a similar picture. PMI’s Pulse of the Profession 2018 found 15% of projects were deemed failures in that year, as stated in PMI’s 2018 report.
Failure by project size
Size is the strongest predictor of failure in every dataset that splits the numbers. Small projects succeed most of the time, and the largest ones rarely do. The project life cycle stages show where large projects usually go wrong.
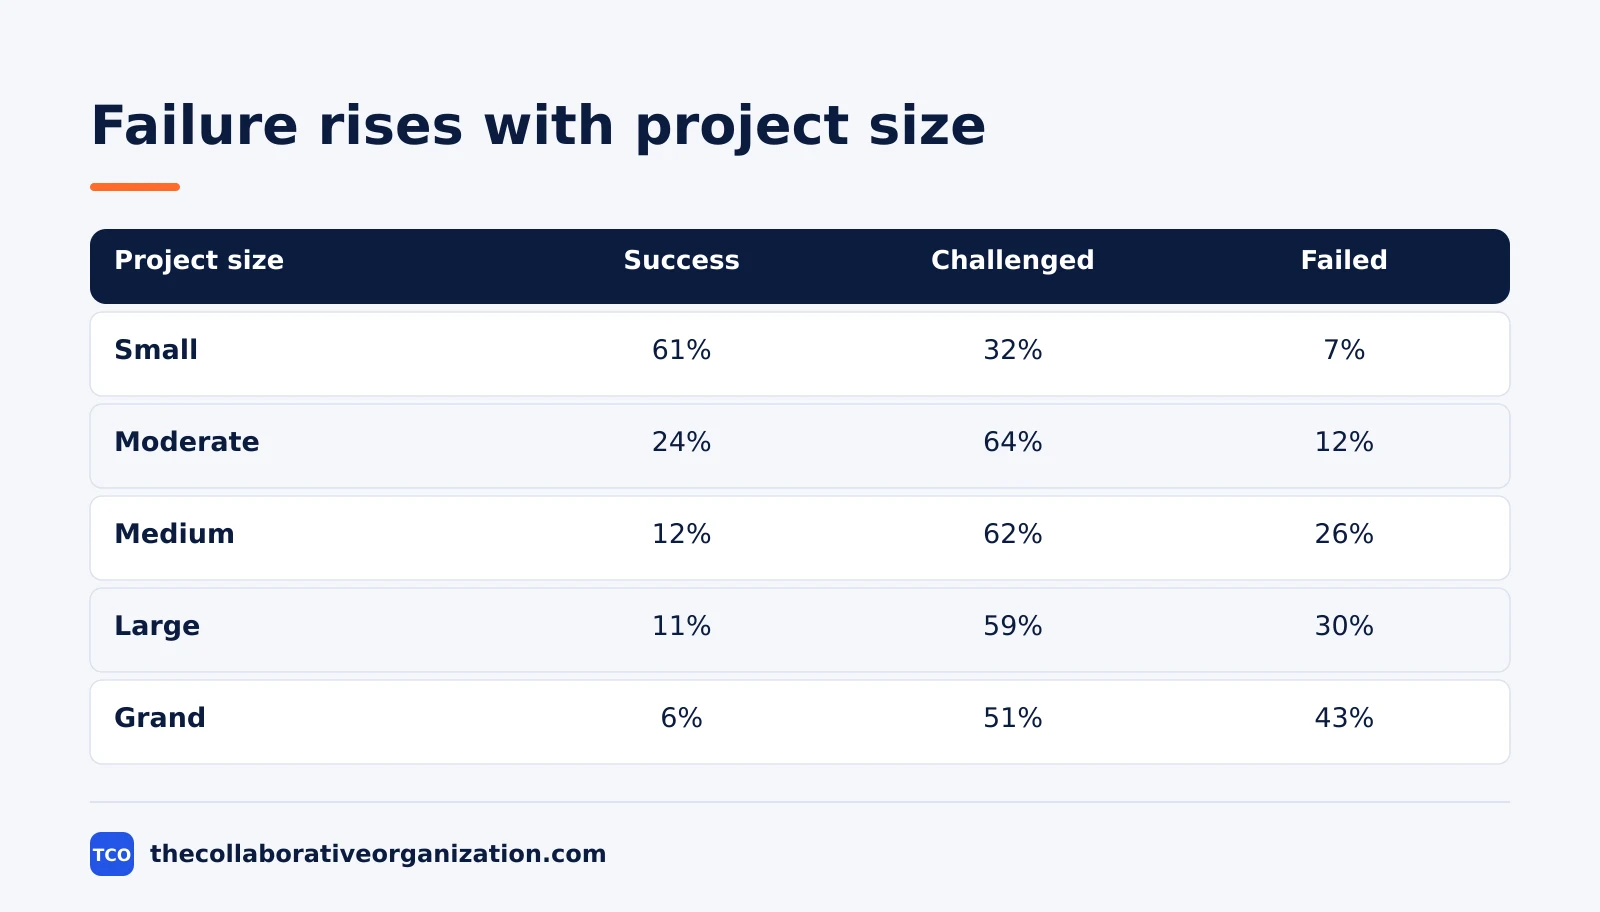
The Standish CHAOS 2015 data shows the pattern clearly. Small projects succeeded 61% of the time and failed 7% of the time. Moderate projects succeeded 24% and failed 12%.
Medium projects succeeded 12% and failed 26%. The CHAOS 2015 size table reproduces the figures from the primary report.
The largest projects do worst. Large projects in the same 2015 data succeeded 11% of the time and failed 30% of the time. Grand projects, the largest band, succeeded 6% and failed 43%, per the CHAOS 2015 size table.
The same pattern holds for the strictest test. Bent Flyvbjerg’s database of more than 16,000 projects in 136 countries found only 8.5% came in on budget and on time, and just 0.5% also delivered the promised benefits. The figures are quoted in a New Civil Engineer interview with Flyvbjerg.
That means 91.5% of large projects miss budget or schedule, and 99.5% miss at least one of budget, schedule or benefits. The same Flyvbjerg interview gives both shares from the same database.
Why projects fail: the ranked causes
The top causes of failure are about the target moving, not about the team working slowly. PMI’s 2018 survey asked respondents to name the primary causes of failed projects, and the ranking has held up in later work.
A change in the organisation’s priorities was the top cause, named by 39% of respondents. A change in project objectives followed at 37%, and inaccurate requirements gathering at 35%. The three figures come from PMI’s 2018 cause ranking, which lists 16 named causes and lets respondents name up to three.
The next causes are about control and people. Inadequate vision or goal was named by 29%, poor communication by 29%, and opportunities and risks not defined by 29%, per PMI’s 2018 ranking.
Sponsor and estimate problems follow close behind. Poor change management was named by 28%, inaccurate cost estimates by 28%, inadequate sponsor support by 26%, and inaccurate task time estimates by 25%, in PMI’s 2018 ranking.
Two more causes complete the picture. An inexperienced project manager was named by 22% of respondents, and team member procrastination by 13%, in the same PMI ranking; respondents could name up to three causes, so the shares add to more than 100%.
Wellingtone’s 2025 survey tells a similar story. Scope creep or unrealistic deadlines was the top failure reason at 41%, followed by not enough resources at 18%, no clear objectives at 16%, no executive support at 14% and lack of communication at 11%, according to a published summary of the gated report.
Requirements deserve a closer look. PMI’s requirements research found nearly half, 47%, of unsuccessful projects fail to meet goals due to inaccurate requirements management, per PMI’s requirements study.
The cost of failure: budget, time and value
Failure is expensive in three currencies at once: money overspent, time lost and value never delivered. The McKinsey and Oxford study puts the largest numbers on all three.
Large IT projects run 45% over budget on average, according to McKinsey’s research with the University of Oxford on more than 5,400 IT projects. The same study found they run 7% over time while delivering 56% less value than predicted. The McKinsey report defines large as an initial price tag over $15 million.
Software projects overrun most. In the same McKinsey and Oxford data, software projects averaged a 66% cost overrun, against 43% for non-software projects, the 2012 study reports.
Some projects go badly enough to threaten the company. McKinsey found 17% of IT projects are “black swans” with budget overruns over 200%. The same study also found the total cost overrun across the 5,400 projects was $66 billion.
Time makes it worse. The McKinsey and Oxford researchers found the longer a project is scheduled to last, the more likely it is to run over, with every additional year adding roughly 15% to the cost overrun, as the McKinsey study states.
The waste figure from PMI matches. PMI’s Pulse 2018 found 9.9% of every dollar is wasted due to poor project performance, or $99 million for every $1 billion invested, as PMI’s 2018 report states.
Scope creep adds to the bill. PMI’s 2018 survey found 52% of projects completed in the past 12 months experienced scope creep or uncontrolled changes to scope, according to PMI’s Pulse of the Profession 2018.
What cuts the failure rate
The evidence points to a short list of fixes, and measurement sits at the top of it. PMI’s success study tested which habits actually moved the score. The habits start with the basics in our guide to what project management is.
Only 37% of projects do all three measurement steps: define success criteria upfront, put a measurement system in place and track performance throughout. Projects with a measurement system had a Net Project Success Score of 45, against 6 for those without one. PMI reports the 7.2 times gap in its 2024 study.
Other levers help too. Caring for team morale carried a 4.2 times multiplier on success, adequate funding to completion carried 3.3 times, and effective resource management carried 3.1 times, per PMI’s 2024 success study.
A sound business case matters as well. PMI found a sound business case carried a 2.4 times multiplier, while minimum start-up difficulties carried 1.6 times, in the same 2024 study.
Business acumen cuts failure directly. PMI found professionals with high business acumen had a project failure rate of 8%, against 11% for those with lower proficiency. The gap is reported in PMI’s Talent Triangle research.
Smaller scope is the structural fix. The Standish size data shows small projects succeed about ten times as often as the largest ones. Splitting a large project into smaller pieces with their own dates is the most reliable way to cut the failure rate, and our guide to how to create a project plan covers how to break work down.
How we chose these stats
Every stat in the table below comes from a report or dataset we read on 19 November 2026, with the source and year shown. Where the original report is gated or paid, we link the closest published summary and say so in the text above.
We dropped figures we could not trace to a published study. The widely quoted claim that 70% of projects fail has no original source, so it is not in this article. We also dropped any figure quoted as a “CHAOS Report 2024”, because the final CHAOS edition was published in 2020.
Survey figures are self-reported, so treat them as a guide, not as audited results. The studies measure different things: PMI counts value delivered, Standish counts time, budget and scope, and Flyvbjerg counts budget, time and benefits together. Do not average figures across studies, and do not compare them as if they used the same definition.
Standish figures carry one more warning. The CHAOS method has been criticised in academic work, including Eveleens and Verhoef in IEEE Software in 2010, for defining success only by estimation accuracy. Read the Standish numbers as an order of magnitude, not as a measurement to two decimal places.
Project failure rate statistics table
The table below lists 33 statistics from the reports above, grouped by theme. Use it as a quick reference, and follow the links in the text for the full context of each figure.
| Statistic | Source | Year |
|---|---|---|
| 12% of projects outright failures | PMI Maximizing Project Success | 2024 |
| 48% of projects successful | PMI Maximizing Project Success | 2024 |
| 40% of projects mixed results | PMI Maximizing Project Success | 2024 |
| 13% of projects outright failures | PMI Project Success Survey | 2025 |
| 50% of projects successful, 37% mixed | PMI Project Success Survey | 2025 |
| 15% of projects deemed failures | PMI Pulse of the Profession | 2018 |
| 19% of software projects fail outright | Standish CHAOS Report | 2020 |
| 50% of software projects challenged | Standish CHAOS Report | 2020 |
| 31% of software projects fully succeed | Standish CHAOS Report | 2020 |
| 31.1% of projects cancelled | Standish CHAOS Report | 1994 |
| 16.2% of projects succeeded | Standish CHAOS Report | 1994 |
| Small projects: 7% fail, 61% succeed | Standish CHAOS Report | 2015 |
| Moderate projects: 12% fail, 24% succeed | Standish CHAOS Report | 2015 |
| Medium projects: 26% fail, 12% succeed | Standish CHAOS Report | 2015 |
| Large projects: 30% fail, 11% succeed | Standish CHAOS Report | 2015 |
| Grand projects: 43% fail, 6% succeed | Standish CHAOS Report | 2015 |
| 0.5% on budget, on time and with benefits | Flyvbjerg database | 2023 |
| 8.5% on budget and on time | Flyvbjerg database | 2023 |
| 91.5% miss budget or schedule | Flyvbjerg database | 2023 |
| Change in priorities: 39% name it as a cause | PMI Pulse of the Profession | 2018 |
| Change in objectives: 37% name it as a cause | PMI Pulse of the Profession | 2018 |
| Inaccurate requirements: 35% name it as a cause | PMI Pulse of the Profession | 2018 |
| Poor communication: 29% name it as a cause | PMI Pulse of the Profession | 2018 |
| Inadequate sponsor support: 26% name it as a cause | PMI Pulse of the Profession | 2018 |
| Scope creep or unrealistic deadlines: 41% | Wellingtone State of PM | 2025 |
| 47% of unsuccessful projects fail on requirements | PMI Requirements Management | 2018 |
| Large IT projects 45% over budget | McKinsey and Oxford | 2012 |
| Large IT projects 56% less value than predicted | McKinsey and Oxford | 2012 |
| 17% of IT projects are black swans over 200% | McKinsey and Oxford | 2012 |
| Software projects 66% average cost overrun | McKinsey and Oxford | 2012 |
| 9.9% of every dollar wasted | PMI Pulse of the Profession | 2018 |
| 52% of projects experienced scope creep | PMI Pulse of the Profession | 2018 |
| High business acumen: 8% failure vs 11% | PMI Pulse of the Profession | 2025 |
What the numbers mean
Three conclusions follow from the numbers, and each one points to a different fix. Read them together before deciding what to change.
First, failure is usually a moving target, not a lazy team. The top three causes in PMI’s ranking are all about priorities, objectives and requirements changing or never being clear. Lock the scope and the success criteria early, and revisit them only through a formal change process.
Second, size is the lever with the biggest effect. Small projects fail 7% of the time and grand projects fail 43% of the time in the same dataset. If a project is large, split it, shorten it, or both, before adding more people or more process.
Third, measurement and sponsorship beat method. PMI found no performance gap between methods, but a large gap between projects that measure success and those that do not. An engaged sponsor and a clear business case matter more than the choice between agile and predictive, and a clear plan shows how to build both in.
Sources
- PMI - Reframing Project Success (2024)
- PMI - Project Success 2025 (2025)
- PMI - PMI Talent Triangle (2025)
- Standish - CHAOS Report, via summary (2020)
- Standish - CHAOS by Size, via summary (2015)
- PMI - Pulse of the Profession 2018 (2018)
- McKinsey - Delivering Large-Scale IT Projects (2012)
- Flyvbjerg - Megaproject Interview (2023)
- Wellingtone - State of Project Management 2025, via summary (2025)
Frequently asked questions
What is the project failure rate?
It depends on the definition. PMI found in 2025 that 13% of projects failed outright and 37% partly delivered. Standish found 19% of software projects failed in 2020. By a strict budget, time and benefits test, Flyvbjerg found only 0.5% of large projects fully succeeded.
What is the most common cause of project failure?
A change in the organisation's priorities was the top cause in PMI's 2018 survey, named by 39% of respondents. A change in project objectives followed at 37%, and inaccurate requirements gathering at 35%. The target moves or was never clear in the first place.
Do large projects fail more often than small ones?
Yes, by a wide margin. In Standish CHAOS 2015 data, small projects succeeded 61% of the time and failed 7% of the time, while the largest projects succeeded 6% of the time and failed 43% of the time. Size is the strongest single predictor of failure.
How much money do failed projects waste?
PMI found 9.9% of every dollar invested is wasted due to poor project performance, which is $99 million for every $1 billion invested. McKinsey and Oxford put the total cost overrun across 5,400 large IT projects at $66 billion.
Can project failure be prevented?
Most of it can be reduced, not removed. PMI found projects that define success, measure it and track it nearly double their success score. Clear requirements, stable priorities, an engaged sponsor and a realistic plan are the levers with the best evidence behind them.
Related articles

project management
How to Choose Project Management Software (2026)
Pick project management software in seven steps: define the work, count seats, price the real cost, and run a two-week pilot before you pay.
November 19, 2026 · 10 min read

project management
What Is a RACI Matrix? Definition, Roles and Examples (2026)
A RACI matrix maps who is Responsible, Accountable, Consulted and Informed for each task. Learn the four roles, how to build one, and see a worked example.
November 19, 2026 · 9 min read
project management
Daily Standup Meeting Format That Works (2026)
A daily standup is a 15-minute meeting where Developers inspect progress toward the Sprint Goal and plan the next day. Use this format to run one that ends on time.
November 19, 2026 · 10 min read