Project Management Statistics: 30+ Stats (2026) | The Collaborative Organization
By The Collaborative Organization Team · November 19, 2026 · Last verified November 19, 2026 · 11 min read
Project management statistics show a mixed picture: about half of projects deliver value worth their cost, hybrid methods keep growing, and AI use jumped from 68% to 84% in one year. The numbers below come from PMI, Wellingtone, the US Bureau of Labor Statistics, Digital.ai and Capterra, each with its source and year.
Key takeaways
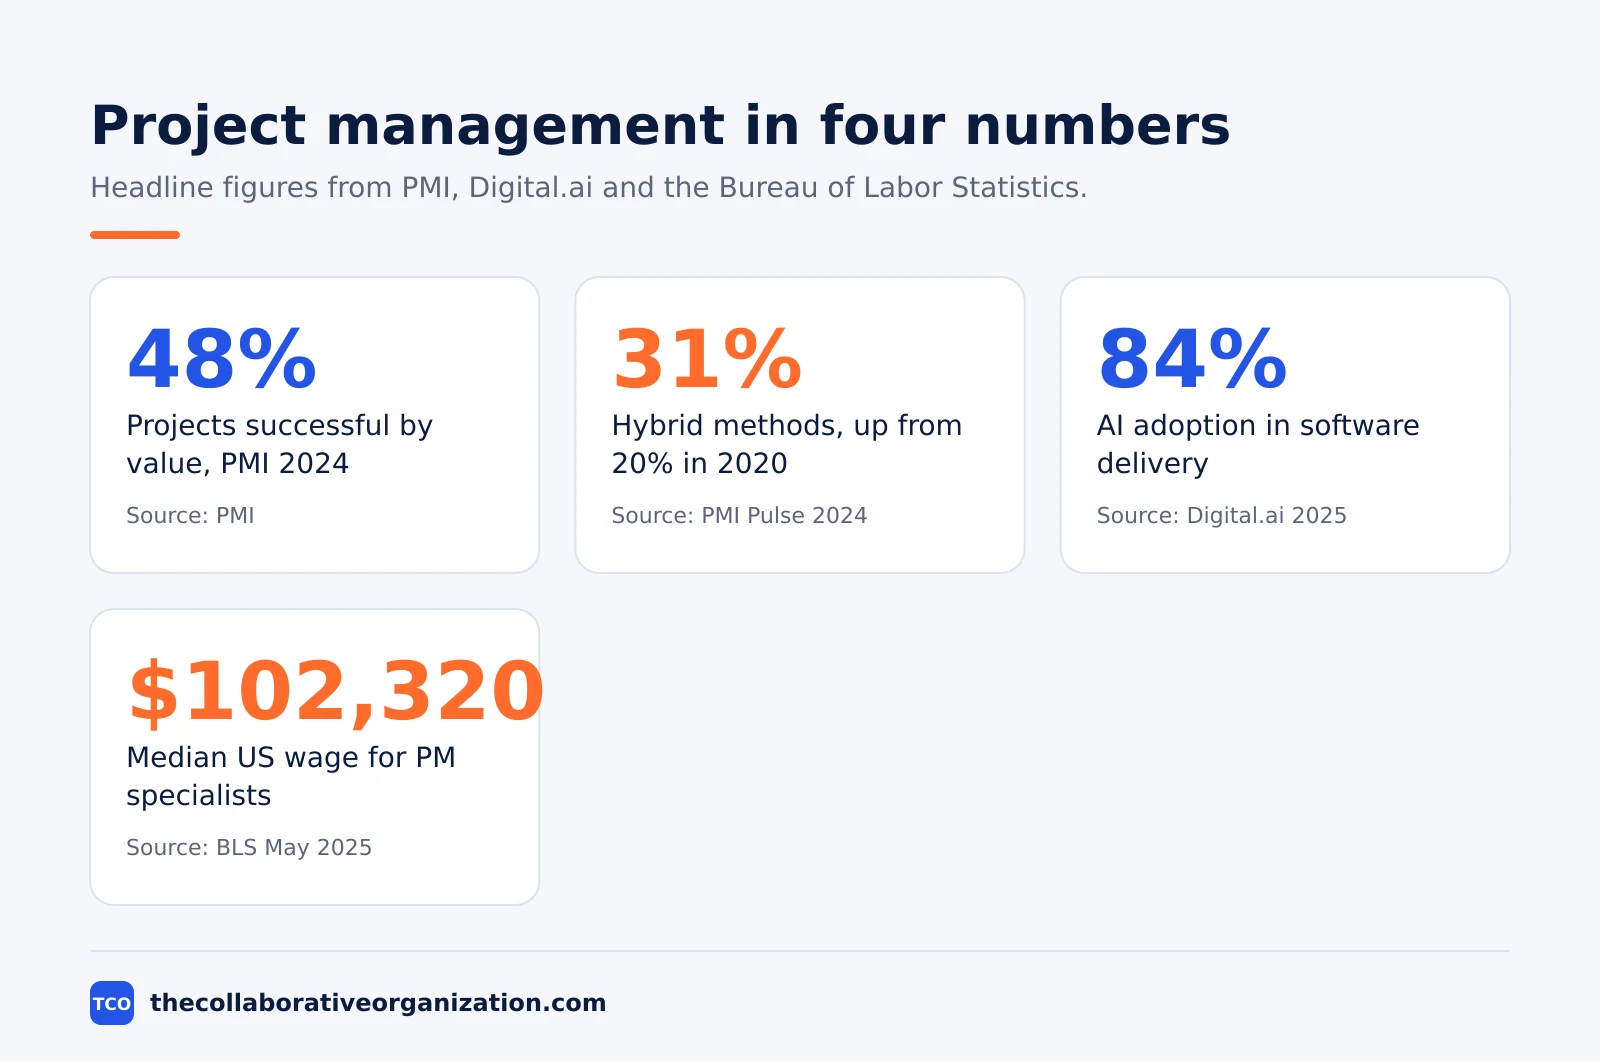
- In 2024, PMI found 48% of projects successful, 40% mixed and 12% outright failures, with a Net Project Success Score of 36.
- Hybrid methods rose from 20% of projects in 2020 to 31% in 2023, per PMI Pulse 2024.
- Only 38% of organisations mostly or always finish projects on time, per Wellingtone in 2025.
- AI adoption in software delivery rose from 68% to 84% in Digital.ai’s 2025 report.
- The median US wage for project management specialists was $102,320 in May 2025, per the Bureau of Labor Statistics.
How projects are doing: success and failure
About half of projects succeed when success means delivering value worth the effort and expense. That is the headline from PMI’s largest study of project success, and it changes how the other numbers should be read.
In 2024, PMI asked nearly 10,000 people in 139 countries to rate their last project on a 0 to 10 scale for value delivered against effort and expense. The result was 48% successful, 40% mixed and 12% outright failures, giving a Global Net Project Success Score of 36. PMI published the definition and the figures in September 2024.
The 2025 survey moved the numbers slightly. PMI’s 2025 study of 5,842 project professionals found 50% successful, 37% mixed and 13% failures, for a Net Project Success Score of 37. The PMI 2025 report shows the new definition is holding steady year to year.
An older measure tells a harsher story. The Standish Group’s CHAOS Report 2020, the final edition of its long-running study, found 31% of software projects fully successful, 50% challenged and 19% failed outright. The report is paid, so the figures here come from a published summary of the report.
Size matters more than method. In the Standish CHAOS 2015 data, small projects succeeded 61% of the time while the largest “grand” projects succeeded only 6% of the time, with failure rates of 7% and 43%. The size breakdown comes from a page that read the figures from the primary report.
Megaprojects do worst of all. Bent Flyvbjerg’s database of more than 16,000 projects in 136 countries found only 8.5% came in on budget and on time, and just 0.5% also delivered the promised benefits. The figures are quoted in a New Civil Engineer interview with Flyvbjerg.
What lifts success is measurement, not method. PMI found only 37% of projects do all three measurement steps: define, measure and track success in the project plan. Projects with a measurement system had a Net Project Success Score of 45, against 6 for those without one, per the same PMI study.
How teams deliver: time, budget and benefits
Most organisations struggle to finish on time, on budget and with the full benefits promised. Wellingtone’s 2025 survey of project professionals puts hard numbers on each gap. The project management process covers how time, budget and benefits are tracked through a project.
Only 38% of organisations mostly or always complete projects on time, according to the Wellingtone 2025 findings. The same survey found 41% mostly or always finish within budget. The Wellingtone report itself is gated, so these figures come from a published summary of the report.
Benefits are the weakest link. Just 39% of organisations mostly or always deliver the full benefits of their projects, per the same Wellingtone summary. That gap between finishing a project and delivering its promised value is the theme of PMI’s new success definition too.
Reporting still eats time. The Wellingtone 2025 survey found 42% of project professionals spend one or more days each month collating reports by hand, and 48.5% of organisations have no access to real-time KPIs.
Waste is the cost of weak delivery. PMI’s Pulse of the Profession 2018 found 9.9% of every dollar is wasted due to poor project performance, which is $99 million for every $1 billion invested, as stated in PMI’s 2018 report.
Scope creep is common. PMI’s 2018 survey found 52% of projects completed in the past 12 months experienced scope creep or uncontrolled changes to scope, according to PMI’s Pulse of the Profession 2018.
How teams work: methods, tools and skills
Hybrid working is the clear trend, and most teams now mix methods rather than following one by the book. The shift shows up in PMI’s data and in the agile surveys.
Hybrid approaches rose from 20% of projects in 2020 to 31% in 2023, according to a published summary of PMI Pulse 2024. The same report found the average project performance rate across all respondents was 73.8%, meaning that share of completed projects met business goals.
Performance does not depend much on method. PMI’s 2024 report found no statistically significant difference in project performance between predictive, agile and hybrid approaches, as the Pulse 2024 summary reports. The differences between the methods are covered in our guide to what agile project management is.
Spreadsheets still run many projects. The Wellingtone 2025 survey found 21% of project teams still rely on spreadsheets to run their projects, and 11% of organisations have no project management solution at all.
Resource management is the top challenge. The Wellingtone 2025 survey found 40% of project professionals said resource management is the biggest challenge they face.
Business acumen is rare and it pays. PMI found only 18% of project professionals show high business acumen, while 66% sit at a moderate level. High-acumen professionals had a project failure rate of 8%, against 11% for lower proficiency, per PMI’s Talent Triangle research.
Training does not match the need. Organisations allocate only 25% of training hours to developing business acumen, against 46% for technical skills, according to the same PMI research. Our guide to what project management is explains how these skills fit together.
AI in project management
AI moved from experiment to standard practice in a single year, but governance has not kept up. The 2025 Digital.ai report and the 2024 Capterra survey agree on the direction.
AI adoption in software delivery rose from 68% to 84% between Digital.ai’s 2024 and 2025 reports. The Digital.ai press release also notes that 41% of organisations now run AI tools in a coordinated way across teams.
Pressure to prove value is rising with adoption. Digital.ai’s 2025 survey found 76% of respondents cited increased scrutiny on the business impact and ROI of agile, and only 49% have governance guardrails in place.
Hybrid agile models now dominate. Digital.ai’s 2025 State of Agile report found 74% of organisations use hybrid, blended or homegrown agile models, and 41% increased agile spending over the past two years.
Capterra’s global survey found 46% of project managers were already using AI in their project tools in 2024. Of those users, 90% reported a positive ROI in the past year, according to a Capterra survey write-up, and they planned to increase AI investment by 36% by 2025.
Task automation is the top AI use. Capterra found 52% of AI users apply it to task automation and 51% to risk management, while 54% use AI to predict risks and suggest fixes. The Australian subset of the same survey reported 88% positive ROI, per the Capterra Australia report.
Salaries and demand for project professionals
Demand for project professionals is strong, and pay rises with certification and experience. The US government and PMI data point the same way.
The US Bureau of Labor Statistics put the median annual wage for project management specialists at $102,320 in May 2025. The lowest 10% earned under $61,580 and the highest 10% earned over $167,970, per the BLS Occupational Outlook Handbook.
Jobs are growing faster than average. The same BLS outlook projects employment of project management specialists to grow 7% from 2025 to 2035, with about 76,500 openings each year. The BLS page counts 1,094,300 jobs in the occupation in 2025.
Certification carries a pay gap. PMI’s 14th-edition salary survey found US PMP holders earned a median of $135,000, against $109,157 for non-certified peers, a gap of nearly 24%. The survey covered 14,628 professionals in 21 countries, and the figures here come from a published summary because the PMI report is paid.
Experience adds more. The published summary of PMI’s salary survey puts the gap wider with experience: US PMP holders certified for more than 10 years earned a median of $173,000, against $123,000 for those certified under 5 years.
The global need is large. PMI estimates the global economy will need 2.3 million new project-oriented roles every year through 2030, with a possible shortfall of up to 25 million project professionals by 2030. The estimate is quoted by Columbia University.
What the numbers mean
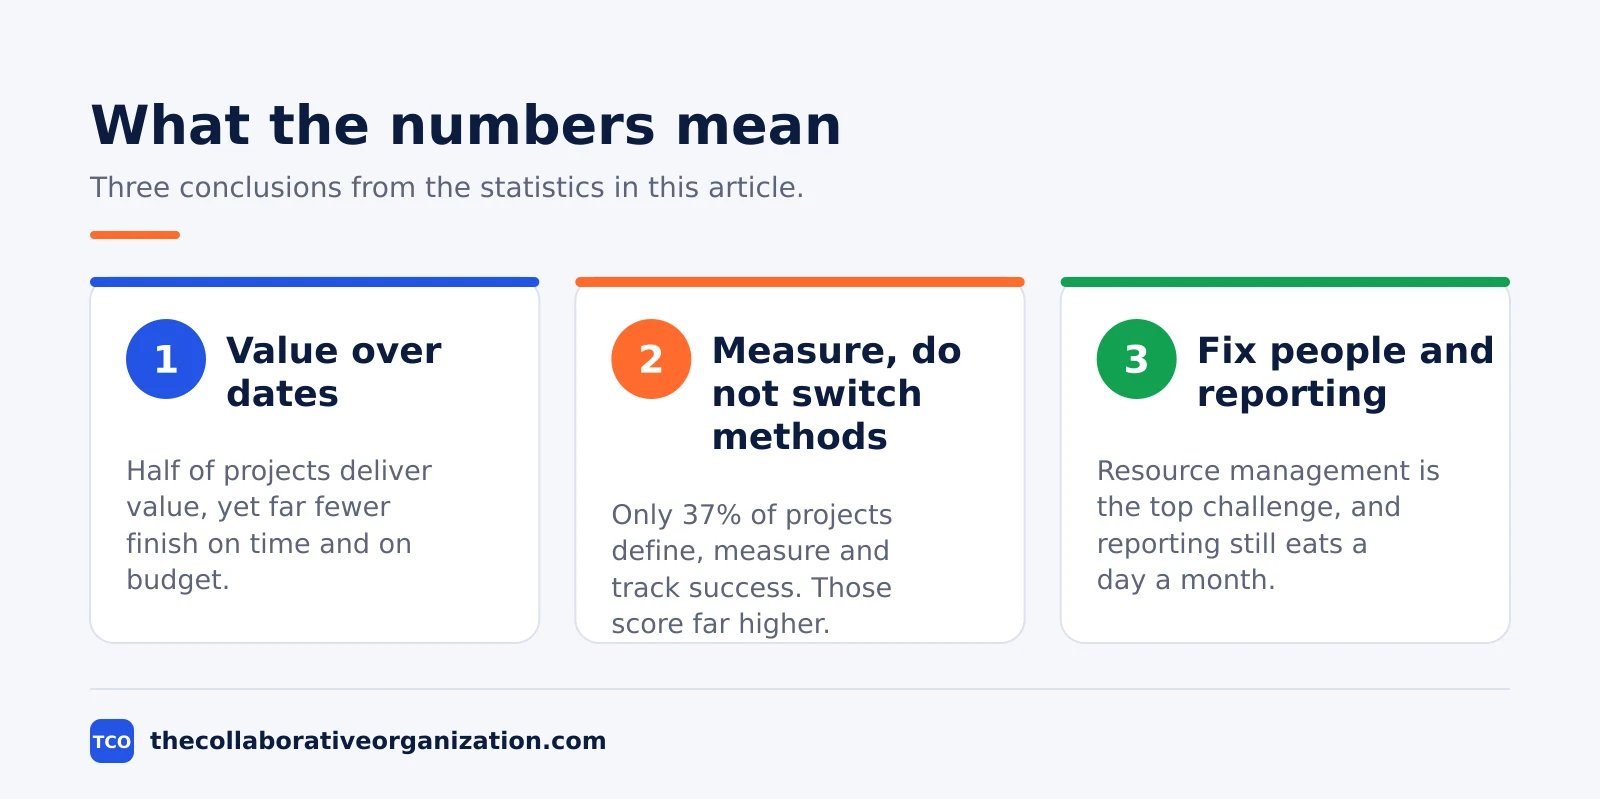
The numbers point to three conclusions, and each one changes what a team should do next. Read them together rather than picking the most dramatic figure.
First, success is about value, not dates. Half of projects deliver value worth their cost, yet far fewer finish on time and on budget. A project that ships late but delivers the promised benefit can still count as a success, which is why PMI changed its definition.
Second, method matters less than measurement. Hybrid use keeps rising, but PMI found no performance gap between methods. The gap that matters is measurement: only 37% of projects define, measure and track success, and those that do score far higher.
Third, the bottleneck is people and reporting, not tools. Resource management is the top challenge, 42% of professionals lose a day a month to manual reporting, and only 18% show high business acumen. Fixing those three gaps is cheaper than buying another tool, and the project management software shortlist helps only once the process is clear.
How we chose these stats
Every stat in the table below comes from a report or dataset we read on 19 November 2026, with the source and year shown. Where the original report is gated or paid, we link the closest published summary and say so in the text above.
We dropped figures we could not trace to a published study. The widely quoted claim that 70% of projects fail has no original source, so it is not in this article. We also dropped figures from AI-generated stat lists that gave no original report.
Survey figures are self-reported, so treat them as a guide, not as audited results. Samples lean toward larger firms and certified professionals. Figures from different studies measure different things, so do not average them or compare them as if they used the same definition.
Project management statistics table
The table below lists 31 statistics from the reports above, grouped by theme. Use it as a quick reference, and follow the links in the text for the full context of each figure.
| Statistic | Source | Year |
|---|---|---|
| 48% of projects successful (value-based) | PMI Maximizing Project Success | 2024 |
| 12% of projects outright failures | PMI Maximizing Project Success | 2024 |
| Net Project Success Score 36 | PMI Maximizing Project Success | 2024 |
| 50% of projects successful, 13% failures | PMI Project Success Survey | 2025 |
| Net Project Success Score 37 | PMI Project Success Survey | 2025 |
| 37% of projects do all three measurement steps | PMI Maximizing Project Success | 2024 |
| Measurement system lifts NPSS from 6 to 45 | PMI Maximizing Project Success | 2024 |
| Hybrid methods 20% in 2020 to 31% in 2023 | PMI Pulse of the Profession | 2024 |
| Average project performance rate 73.8% | PMI Pulse of the Profession | 2024 |
| 38% of organisations mostly or always on time | Wellingtone State of PM | 2025 |
| 41% of organisations mostly or always within budget | Wellingtone State of PM | 2025 |
| 39% of organisations mostly or always deliver full benefits | Wellingtone State of PM | 2025 |
| 42% spend 1+ days a month collating reports by hand | Wellingtone State of PM | 2025 |
| 48.5% of organisations have no real-time KPIs | Wellingtone State of PM | 2025 |
| 21% of teams still rely on spreadsheets | Wellingtone State of PM | 2025 |
| 11% of organisations have no PM solution at all | Wellingtone State of PM | 2025 |
| 40% say resource management is the biggest challenge | Wellingtone State of PM | 2025 |
| 9.9% of every dollar wasted on poor performance | PMI Pulse of the Profession | 2018 |
| 52% of projects experienced scope creep | PMI Pulse of the Profession | 2018 |
| 18% of professionals show high business acumen | PMI Pulse of the Profession | 2025 |
| 8% failure rate for high-acumen professionals vs 11% | PMI Pulse of the Profession | 2025 |
| AI adoption in software delivery 68% to 84% | Digital.ai State of Agile | 2025 |
| 76% cite increased ROI scrutiny for agile | Digital.ai State of Agile | 2025 |
| 49% have AI governance guardrails in place | Digital.ai State of Agile | 2025 |
| 74% use hybrid or homegrown agile models | Digital.ai State of Agile | 2025 |
| 46% of PMs already using AI in PM tools | Capterra PM Tools Survey | 2024 |
| 90% of AI users report positive ROI | Capterra PM Tools Survey | 2024 |
| Median US wage $102,320 for PM specialists | US Bureau of Labor Statistics | 2025 |
| Employment growth 7% from 2025 to 2035 | US Bureau of Labor Statistics | 2025 |
| US PMP median $135,000 vs $109,157 non-certified | PMI Salary Survey, 14th edition | 2025 |
| 2.3 million new project roles needed per year | PMI Talent Gap | 2025 |
Sources
- PMI - Reframing Project Success (2024)
- PMI - Project Success 2025 (2025)
- PMI - PMI Talent Triangle (2025)
- PMI - Pulse of the Profession 2024, via summary (2024)
- Wellingtone - State of Project Management 2025, via summary (2025)
- Digital.ai - 18th State of Agile Report (2025)
- Capterra - AI in Project Management Survey (2024)
- BLS - Project Management Specialists (2025)
- PMI - Salary Survey 14th Edition, via summary (2025)
- PMI - Pulse of the Profession 2018 (2018)
Frequently asked questions
What percentage of projects succeed?
It depends on how you count success. PMI found in 2024 that 48% of projects delivered value worth the effort and expense, with 12% outright failures. In 2025 the same measure gave 50% successful and 13% failures. Older measures based only on time and budget give lower success rates.
What is the most common project management method?
Mixed methods are the most common. PMI found hybrid approaches rose from 20% of projects in 2020 to 31% in 2023. Pure agile and pure predictive methods are both used, but most teams now blend them to fit the work.
How much does a project manager earn in the United States?
The US Bureau of Labor Statistics put the median annual wage for project management specialists at $102,320 in May 2025. PMI found PMP-certified professionals in the United States earned a median of $135,000, against $109,157 for non-certified peers.
Is AI widely used in project management?
Yes, and use is rising fast. Digital.ai found AI adoption in software delivery rose from 68% to 84% between its 2024 and 2025 reports. Capterra found 46% of project managers were already using AI in their project tools in 2024.
How many project professionals will be needed by 2030?
PMI estimates the global economy will need 2.3 million new project-oriented roles every year through 2030. Without enough new talent, the world could face a shortfall of up to 25 million project professionals by 2030.
Related articles
project management
How to Choose Project Management Software (2026)
Pick project management software in seven steps: define the work, count seats, price the real cost, and run a two-week pilot before you pay.
November 19, 2026 · 10 min read
project management
What Is a RACI Matrix? Definition, Roles and Examples (2026)
A RACI matrix maps who is Responsible, Accountable, Consulted and Informed for each task. Learn the four roles, how to build one, and see a worked example.
November 19, 2026 · 9 min read
project management
Daily Standup Meeting Format That Works (2026)
A daily standup is a 15-minute meeting where Developers inspect progress toward the Sprint Goal and plan the next day. Use this format to run one that ends on time.
November 19, 2026 · 10 min read