Knowledge Management Statistics: 25+ Stats (2026) | The Collaborative Organization
By The Collaborative Organization Team · November 19, 2026 · Last verified November 19, 2026 · 12 min read
Knowledge management statistics show a clear pattern: people spend a large share of every week looking for answers that already exist somewhere in the company. The numbers below come from the original reports, not from roundups. Each figure names its source and its year, so you can check it yourself.
Key takeaways
- Atlassian’s 2025 survey: teams spend 25% of the workweek searching for information.
- McKinsey estimated in 2012 that interaction workers spend nearly 20% of the week looking for internal information.
- Panopto’s 2018 report: 42% of institutional knowledge is unique to the person who holds it.
- Gartner found in 2023 that 47% of digital workers struggle to find the information they need.
- Coveo found in 2025 that workers spend an average of three hours a day searching, and 42% of what they find is irrelevant to their role.
How we chose these stats
We took every number in this article from the publisher’s own report, press release, or dataset, and we checked each one against that source on 19 November 2026. We used the latest edition of each yearly report that includes the figure. Vendor surveys are flagged as vendor surveys, and modelled estimates are flagged as estimates.
We left out figures we could not trace to an original source. That includes the claim that 70% of critical knowledge is tacit, the claim of a 300% return on knowledge management, and several market-size figures that disagree with each other by a factor of three. A smaller set of checked numbers beats a long list of borrowed ones.
The sources are McKinsey Global Institute (2012), Atlassian (2025), Gartner (2023), Panopto (2018), Coveo (2025), APQC (2026), the US Bureau of Labor Statistics (2026), Glean and Harris Poll (2022), and Bloomfire (2025). Older studies are included only where no newer original exists for that finding. The same method was used for our collaboration tools statistics guide.
Where the working week goes
A fifth to a third of the working week goes to finding things, not doing them. The figures below come from six different publishers, and they all point the same way. Read them together before you quote any one of them alone.
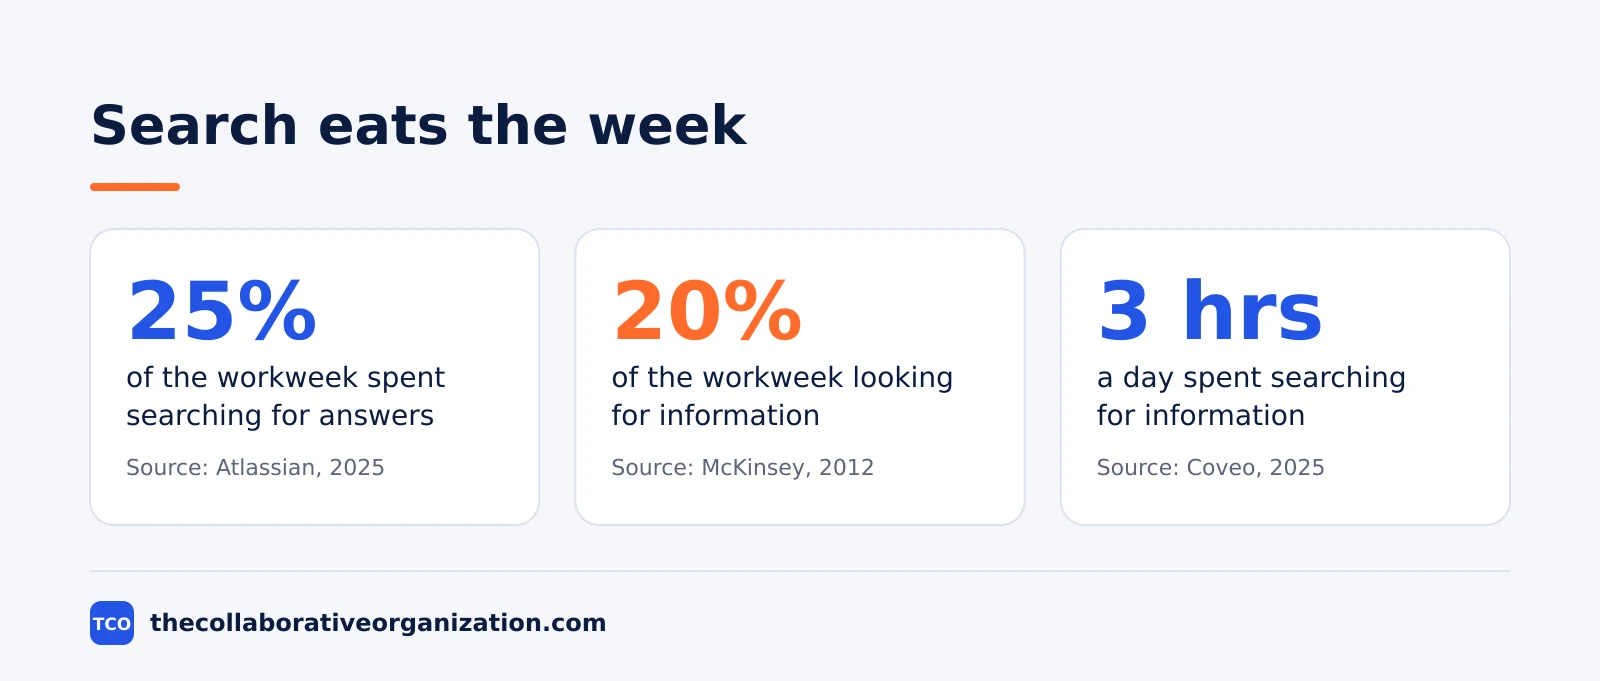
Teams spend 25% of the workweek searching for information, Atlassian’s State of Teams 2025 found in a survey of 12,000 knowledge workers and 200 Fortune 1000 executives. Difficulty finding information was the top barrier to moving fast in the same survey.
The pattern is old. The McKinsey Global Institute estimated in 2012 that interaction workers spend nearly 20% of the workweek looking for internal information or tracking down colleagues, in its report on social technologies. The same report put email at about 28% of the workweek.
Coveo’s 2025 survey found workers waste an average of three hours a day searching for information. The Coveo EX Relevance Report 2025 surveyed 4,000 workers at companies with 5,000 or more employees, and found they search an average of four different systems to find what they need.
Glean’s 2022 survey, run by Harris Poll among 1,043 employed US adults, found workers spend at least two hours a day looking for the documents, information, or people they need. The survey write-up puts that at 25% of the workweek. Glean sells enterprise search, so read it as a vendor survey.
Bloomfire’s 2025 report, published in Harvard Business Review, found workers spend an average of 21% of their work time searching for knowledge and another 14% recreating information they could not find. The HBR article is sponsored content from Bloomfire, based on six months of data from 10,000 customers at 115 companies.
What poor knowledge sharing costs
Poor knowledge sharing costs money in three ways: wasted hours, duplicated work, and lost revenue. The figures below put a number on each one. Treat the modelled figures as estimates, not as measured losses.
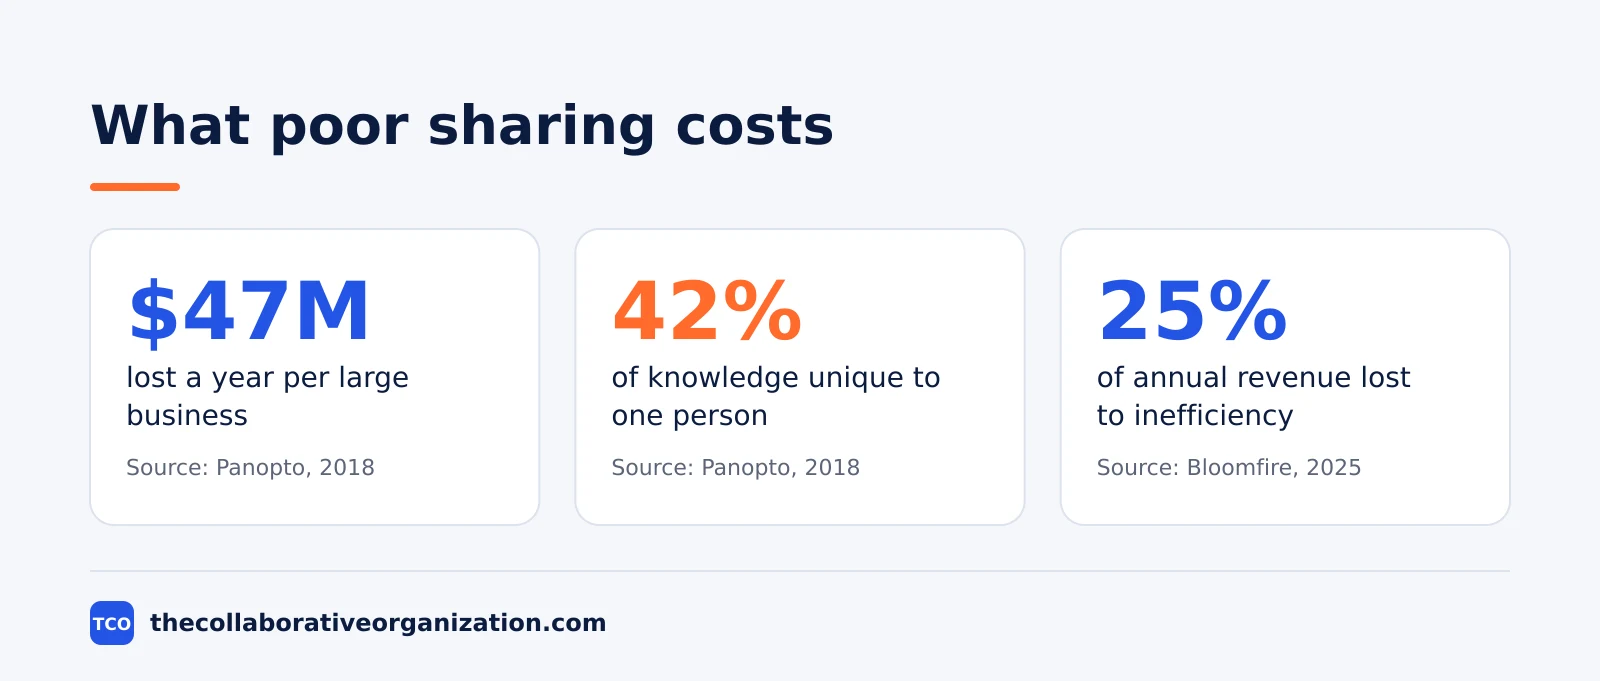
A large US business loses an average of $47 million a year to inefficient knowledge sharing, Panopto modelled in its 2018 report. The model covers a company of 17,700 employees, and it is built from self-reported hours, not from measured losses.
Bloomfire’s 2025 report put the cost higher: inefficiency directly costs a business an average of 25% of its annual revenue. For a Fortune 500 company with $9 billion in revenue, the same Bloomfire report puts about $2.4 billion in enterprise value at stake each year. The figure is a vendor model, so read it as the scale of the problem.
The hours behind those models are large. In Panopto’s survey, employees reported spending 5 hours a week waiting for knowledge from colleagues, 8 hours a week searching inefficiently, and nearly 6 hours a week duplicating work that already exists. Added up, that is close to half a working week.
The upside is large too. The McKinsey Global Institute estimated in 2012 that social technologies could raise the productivity of interaction workers by 20 to 25 percent, in its report on social technologies. The figure is a modelled estimate of what full adoption could bring, not a measured result.
Knowledge that walks out the door
A large share of what a company knows lives in one person’s head, and it leaves when they do. The figures below show how much knowledge is unshared, and how short the time is to capture it.
In Panopto’s 2018 report, 42% of institutional knowledge was unique to the individual who holds it. The press release puts it plainly: that knowledge exists nowhere else in the company. When the person leaves, the knowledge leaves with them.
Employees know the risk. In the same Panopto survey, 85% of employees said preserving knowledge is important, and 63% said they would prefer to work for organizations where unique knowledge is preserved. Only 3% thought preserving knowledge is not important.
The window to capture knowledge is short. The US Bureau of Labor Statistics found median employee tenure was 4.1 years in January 2026, up from 3.9 years in January 2024, in its Employee Tenure release. Private-sector tenure was 3.9 years, against 5.6 years in the public sector.
APQC’s March 2026 research adds a weekly view of the same problem. Knowledge workers spend on average only 65% of their time on productive tasks, and 43% spend time at least once a week recreating processes to perform a task, according to the APQC report. The same report found 72% look for information at least once a week.
Finding answers is hard
Workers do not only lose time searching. They often cannot find the answer at all, or they find the wrong one. The figures below show the gap between having knowledge and reaching it.
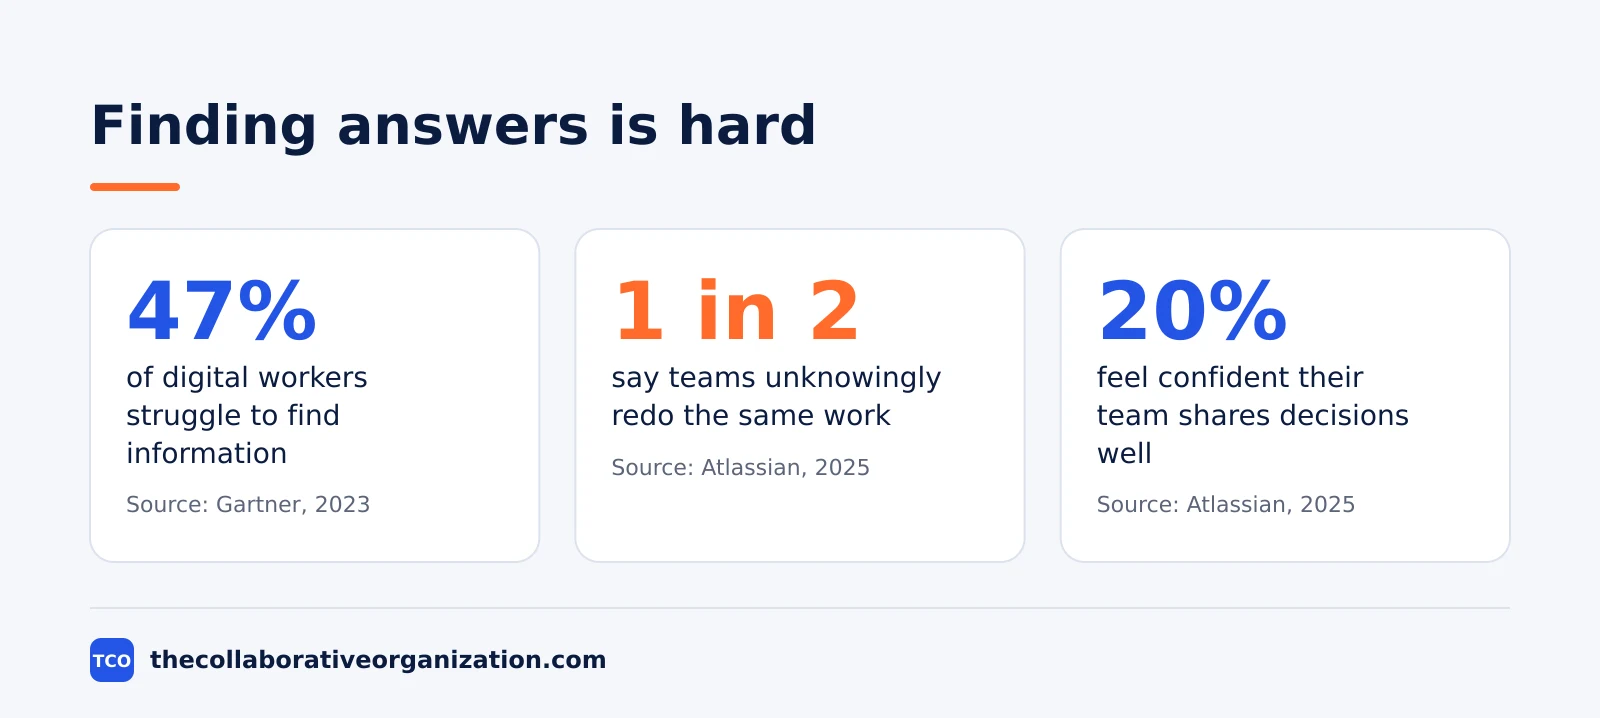
In Gartner’s 2023 survey, 47% of digital workers said they struggle to find the information or data they need to do their jobs. The Gartner press release surveyed 4,861 full-time digital workers in the US, UK, India, and China.
Part of the problem is sprawl. The same Gartner survey found the average desk worker uses 11 applications, up from 6 in 2019, and 66% of respondents agreed better outcomes would follow if IT provided universally accepted applications.
Duplicate work follows. In Atlassian’s State of Teams 2025, one in two knowledge workers said teams at their company tend to unknowingly work on the same things. Only 20% felt confident their team has an effective process for quickly informing other teams of decisions that may affect their work.
When the answer is not written down, the only route to it is another person’s time. In Atlassian’s 2025 survey, 56% of knowledge workers said they often have to ask someone or book a meeting to get the information they need.
Even when workers do find information, much of it does not help. In Coveo’s 2025 report, 42% of the information employees encountered was irrelevant to their role, and 47% felt burned out or frustrated when they did not have the right tools or information. Frustration with unhelpful tools rose from 28% in 2022 to 40% in 2025.
Younger workers search the most. The same Coveo report found Gen Z workers spend 30% of their day searching for information, and Millennials spend 29%. The report also found 42% of employees fact-checked answers from AI tools in 2025, up from 36% in 2024.
The full statistics table
The table below lists 35 statistics from the reports above, grouped by theme, with the source and the year for each one. Use it to check a figure before you quote it. Every number in the table also appears in the text above with a link to its original source.
| Statistic | Source | Year |
|---|---|---|
| Nearly 20% of the workweek looking for internal information or colleagues | McKinsey Global Institute | 2012 |
| About 28% of the workweek spent on email | McKinsey Global Institute | 2012 |
| 20-25% productivity gain from social tech (modelled) | McKinsey Global Institute | 2012 |
| 25% of the workweek spent searching for information | Atlassian State of Teams | 2025 |
| 2.4 billion hours a year wasted searching (Fortune 500) | Atlassian State of Teams | 2025 |
| 1 in 2 say teams unknowingly work on the same things | Atlassian State of Teams | 2025 |
| 20% confident their team shares decisions well | Atlassian State of Teams | 2025 |
| 56% often ask someone or book a meeting for information | Atlassian State of Teams | 2025 |
| 3 hours a day searching for information | Coveo EX Relevance Report | 2025 |
| 42% of information encountered is irrelevant to the role | Coveo EX Relevance Report | 2025 |
| 4 different systems searched on average | Coveo EX Relevance Report | 2025 |
| 47% feel burned out or frustrated without the right tools | Coveo EX Relevance Report | 2025 |
| Frustration with unhelpful tools up from 28% to 40% since 2022 | Coveo EX Relevance Report | 2025 |
| Gen Z spend 30% of their day searching; Millennials 29% | Coveo EX Relevance Report | 2025 |
| 42% fact-checked AI answers, up from 36% in 2024 | Coveo EX Relevance Report | 2025 |
| 47% of digital workers struggle to find information | Gartner Digital Worker Survey | 2023 |
| 11 applications used on average, up from 6 in 2019 | Gartner Digital Worker Survey | 2023 |
| 66% say better outcomes with universally accepted apps | Gartner Digital Worker Survey | 2023 |
| $47 million a year lost per large business (modelled) | Panopto Workplace Knowledge Report | 2018 |
| 42% of institutional knowledge unique to one person | Panopto Workplace Knowledge Report | 2018 |
| 5.3 hours a week waiting or recreating knowledge | Panopto Workplace Knowledge Report | 2018 |
| 5 hours a week waiting for knowledge from colleagues | Panopto Workplace Knowledge Report | 2018 |
| 8 hours a week searching inefficiently | Panopto Workplace Knowledge Report | 2018 |
| Nearly 6 hours a week duplicating others’ work | Panopto Workplace Knowledge Report | 2018 |
| 85% think preserving knowledge is important | Panopto Workplace Knowledge Report | 2018 |
| 63% prefer employers where unique knowledge is preserved | Panopto Workplace Knowledge Report | 2018 |
| 21% of work time searching for knowledge | Bloomfire Value of Enterprise Intelligence | 2025 |
| 14% of work time recreating information not found | Bloomfire Value of Enterprise Intelligence | 2025 |
| 25% of annual revenue lost to inefficiency (modelled) | Bloomfire Value of Enterprise Intelligence | 2025 |
| $2.4B at stake per year for a $9B Fortune 500 company | Bloomfire Value of Enterprise Intelligence | 2025 |
| At least 2 hours a day looking for documents or people | Glean / Harris Poll | 2022 |
| 65% of time on productive tasks on average | APQC Designing Productivity | 2026 |
| 43% recreate processes at least once a week | APQC Designing Productivity | 2026 |
| 72% look for information at least once a week | APQC Designing Productivity | 2026 |
| Median employee tenure 4.1 years, up from 3.9 in 2024 | US Bureau of Labor Statistics | 2026 |
What the numbers mean
The numbers point at one problem: the gap between the person who knows something and the person who needs it. People search for it, ask for it, or book a meeting to get it. Three habits help: write the answer down once, send a short update instead of a status meeting, and show work instead of describing it.
Our workplace collaboration statistics guide tracks the same pattern in meetings and messages.
A worked example shows what the numbers mean for one team. Picture a 100-person team where each person loses a quarter of the week to searching, as Atlassian found in 2025. That is 25 people working full time on finding things, or 1,000 hours a week across the team.
Cutting that search time in half would return about 12 full-time roles’ worth of time to skilled work. The numbers in this example are an illustration, built from Atlassian’s 2025 figure of 25%.
Start with the fix that matches your biggest number. If searching eats a quarter of the week, fix the source of truth first: one home per topic, with an owner and a review date. If duplication is the bigger leak, make work visible before it starts, so teams can see what already exists.
If knowledge leaves with people, capture the critical answers before the expert’s last week, not after. Fixing the habits behind the numbers is team work, and our guide on how to improve team collaboration covers the routines that make shared knowledge stick.
Teams that want to compare tools can look at our document collaboration shortlist before they buy anything to fix a habit problem.
Sources
- McKinsey Global Institute - The Social Economy (2012)
- Atlassian - State of Teams 2025 (2025)
- Atlassian - 6 Async Practices That Surface Buried Insights (2025)
- Gartner - 47% of Digital Workers Struggle to Find Information (2023)
- Panopto - How Much Time Is Lost to Knowledge Sharing? (2019)
- Coveo - EX Relevance Report Reveals 42% of Information Fails Employees (2025)
- APQC - Designing Productivity into Knowledge Work (2026)
- U.S. Bureau of Labor Statistics - Employee Tenure in 2026 (2026)
- Harvard Business Review / Bloomfire - How Knowledge Mismanagement Is Costing Your Company Millions (2025)
- Manufacturing.net - Inefficient Knowledge Sharing Costs Large Businesses $47M Each Year (2018)
Frequently asked questions
How much time do employees spend searching for information at work?
Estimates run from a fifth to a third of the working week. McKinsey estimated nearly 20% in 2012, Atlassian found 25% in its 2025 survey of 12,000 knowledge workers, and Coveo found workers spend an average of three hours a day searching in 2025. The studies measure different things, so read the range as the finding, not any single number.
What does poor knowledge management cost a company?
Panopto modelled the cost of inefficient knowledge sharing at $47 million a year for a large business with 17,700 employees in 2018. Bloomfire's 2025 report put the cost of inefficiency at an average of 25% of a company's annual revenue. Both figures are models built from survey data, not measured losses, so treat them as the scale of the problem.
How much company knowledge is never written down?
Panopto's 2018 report found that 42% of institutional knowledge is unique to the individual who holds it. That knowledge exists only in one person's head, so it leaves with them when they change roles or leave the company. The same report found 85% of employees think preserving knowledge is important.
Why do employees struggle to find information?
Gartner found in 2023 that 47% of digital workers struggle to find the information they need, while the average desk worker uses 11 applications, up from 6 in 2019. Coveo found in 2025 that workers search an average of four different systems, and 42% of the information they meet is irrelevant to their role.
Can I cite these statistics?
Yes. Cite the original source linked beside each number, with its date, so readers can check it. Every figure in this article comes from the publisher's own report, press release, or dataset, and each one was checked against that source on 19 November 2026. Vendor surveys and modelled estimates are flagged where they appear.
Related articles
document collaboration
Airtable vs Google Sheets: Which to Use in 2026
Airtable is a database with views and automations; Google Sheets is a free spreadsheet. Learn the limits, the 2026 prices, and which one fits your team's data.
November 19, 2026 · 7 min read
document collaboration
Confluence vs SharePoint: Which to Use in 2026
Confluence is a wiki built around pages; SharePoint is a document platform built around files. Learn the differences, the 2026 prices, and which one fits your team.
November 19, 2026 · 7 min read
document collaboration
How to Document Processes: A Step-by-Step Guide (2026)
To document a process, pick one task, watch it done for real, map the steps and decisions, then test the draft on someone new. Follow the 7 steps in this guide.
November 19, 2026 · 10 min read