Employee Engagement Statistics: 30+ Key Figures for 2026 | The Collaborative Organization
By The Collaborative Organization Team · November 19, 2026 · Last verified November 19, 2026 · 13 min read
Only 20% of employees worldwide were engaged at work in 2025, and US engagement fell to 29% in the third quarter of 2026, its lowest level since 2011. The numbers come from Gallup, the largest ongoing study of the employee experience, and they are backed by ADP Research and Great Place To Work.
Key takeaways
- Gallup puts global engagement at 20% in 2025, down from a 23% peak in 2022, and the cost of low engagement at about $10 trillion a year.
- US engagement fell to 29% in the third quarter of 2026, down from 31% in the first half of the year and 36% in 2020.
- Manager engagement fell to 22% worldwide in 2025, down 9 points since 2022, while 79% of managers are engaged in best-practice workplaces.
- Top-quartile business units in Gallup’s meta-analysis had 81% lower absenteeism and 23% higher profitability than bottom-quartile units.
- ADP Research puts full engagement at 19% worldwide in 2025, and workers who find meaning in their jobs are 12.5 times more likely to be fully engaged.
How we chose these statistics: every figure below comes from the original publisher, Gallup, ADP Research, or Great Place To Work, and each sentence names its source and year with a link to the original page. We skipped figures we could not trace to a published study, including older Gallup cost totals that a newer report superseded.
Where a figure rests on a press summary of a study rather than the study page itself, the text says so. Gallup and ADP ask different questions, so their engagement rates differ, and both are shown side by side rather than blended into one number.
Engagement around the world
Gallup’s global picture is stark: only one in five workers worldwide is engaged, and no region improved in the past year. The figures below come from the State of the Global Workplace 2026 report, which covers 2025.
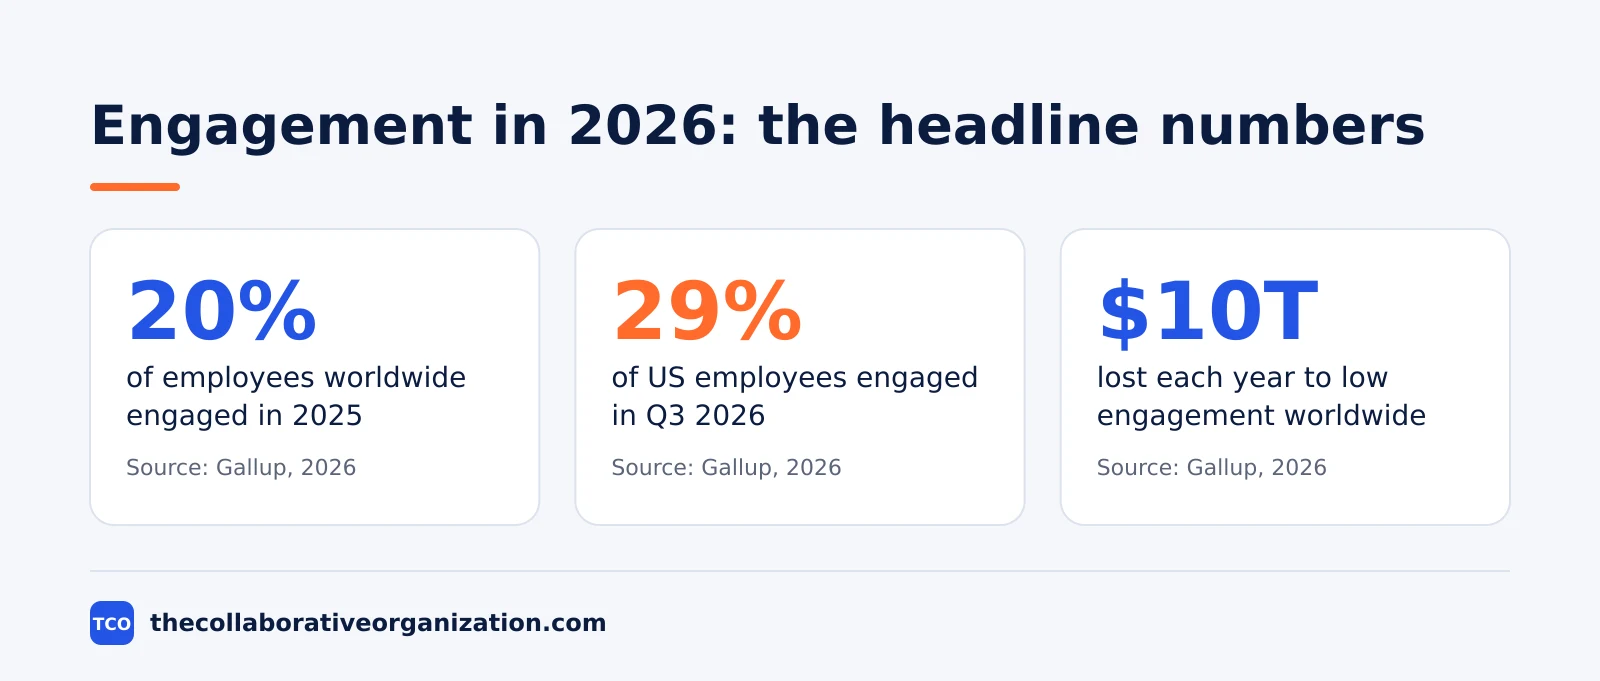
- 20% of employees worldwide were engaged in 2025, down from 23% in 2022 and 2023, according to Gallup’s State of the Global Workplace 2026.
- 64% were not engaged and 16% were actively disengaged in 2025, in the same Gallup global report.
- Global engagement peaked at 23% in 2022, then slipped to 21% in 2024 and 20% in 2025, the first two-year decline in the series, per Gallup (2026).
- Engagement was 12% when Gallup first measured it in 2009, so the 2025 figure is 8 points higher than the series start, according to Gallup (2026).
- Low engagement cost about $10 trillion in lost productivity in 2025, or about 9% of global GDP, in Gallup’s 2026 estimate.
- 52% of employees said it was a good time to find a job in 2025, up 1 point from the year before, per Gallup (2026).
- 34% of employees worldwide were thriving in 2025, up from 33% in 2024, according to Gallup (2026).
- 19% of workers worldwide were fully engaged in 2024, a record high in a decade of ADP data, per ADP Research People at Work 2025.
- 56% of workers surveyed work on site every day, while 12% work fully remotely and 32% work hybrid, in ADP Research (2025).
- Engagement was highest in the Middle East and Africa at 25%, and lowest in Europe at 17%, according to ADP Research (2025).
- 52% of workers on high-performing teams were fully engaged, against 10% of those who said they were not on one, per ADP Research (2025).
Engagement in the United States
US engagement held at 31% through the first half of 2026, then fell to 29% in the third quarter, the lowest reading since 2011. The drop was sharpest among remote and hybrid workers.
- 31% of US employees were engaged in the first half of 2026, unchanged from 2025, with 18% actively disengaged, according to Gallup (July 2026).
- US engagement peaked at 36% in 2020, then fell to 31% in 2024 and held there until mid-2026, per Gallup (July 2026).
- The US has 8 million fewer engaged employees than in 2020, because each point of engagement is about 1.6 million workers, according to Gallup (July 2026).
- Low engagement costs the US economy about $2 trillion a year in lost productivity, in Gallup’s 2026 estimate.
- 49% of US employees strongly agreed they know what is expected of them in the first half of 2026, up from 47%, but far below the 61% peak in 2015, per Gallup (July 2026).
- 29% of US employees were engaged in the third quarter of 2026, the lowest since 2011 and down 2 points in one quarter, according to Gallup (October 2026).
- 53% were not engaged and 18% were actively disengaged in Q3 2026, in the same Gallup report (October 2026).
- The Q3 drop equals about 3.2 million fewer engaged workers, and about 11 million fewer than in 2020, per Gallup (October 2026).
- Engagement fell 5 points among fully remote workers and 2 points among hybrid workers in Q3 2026, while on-site workers moved about 1 point, according to Gallup (October 2026).
- Only 46% strongly agreed they know what is expected of them in Q3 2026, down from 49%, and only 37% strongly agreed someone at work cares about them, per Gallup (October 2026).
Managers and engagement
Managers carry the engagement story: their engagement fell further and faster than anyone else’s, and their teams follow them. Gallup has long found that managers shape how employees experience the workplace.
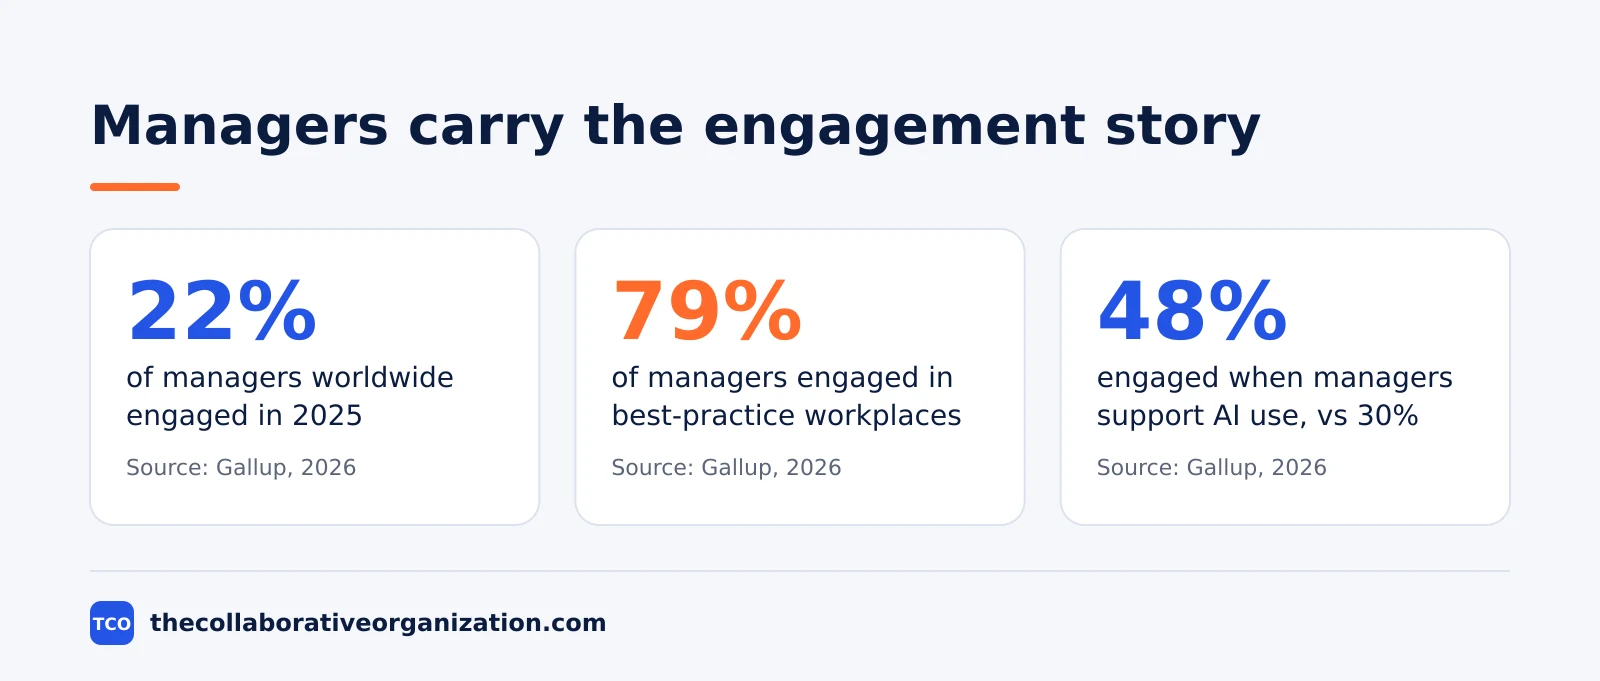
- 22% of managers worldwide were engaged in 2025, down from 31% in 2022 and 27% in 2024, according to Gallup’s State of the Global Workplace 2026.
- The 5-point drop from 2024 to 2025 was the largest annual fall in manager engagement in the Gallup series, per Gallup (2026).
- 19% of individual contributors were engaged in 2025, only 3 points below managers, so the old manager engagement premium has nearly vanished, according to Gallup (2026).
- 79% of managers were engaged in best-practice workplaces in 2025, nearly four times the global average, per Gallup (2026).
- Engaged managers are 14 points more likely to be thriving in life than the average leader, according to Gallup (2026).
- Leaders report more stress (+7 points), anger (+12), sadness (+11) and loneliness (+10) than individual contributors on the previous day, per Gallup (2026).
What engagement is worth to a business
Engaged teams perform better on nearly every measure Gallup tracks, from absence to profit. The figures below come from Gallup’s 10th Q12 meta-analysis, which pooled 456 studies across 276 organizations in 54 industries and 96 countries, covering 112,312 work units and 2.7 million employees.
- Top-quartile business units had 81% lower absenteeism than bottom-quartile units, according to Gallup’s Q12 meta-analysis (2020, updated 2026).
- Top-quartile units had 23% higher profitability than bottom-quartile units, per the same Gallup meta-analysis (2020).
- Top-quartile units had 18% higher productivity (sales) than bottom-quartile units, according to Gallup (2020).
- Turnover was 43% lower in low-turnover organizations and 18% lower in high-turnover organizations for top-quartile units, per Gallup (2020).
- Customer loyalty was 10% higher in top-quartile units, according to Gallup (2020).
- Patient safety incidents were 58% lower in top-quartile units, per Gallup (2020).
- 85% of employees at Great Place To Work Certified companies say they give extra effort, against 60% at a typical US workplace, according to Great Place To Work (2024-2025).
- Voluntary turnover is 12% at Certified companies against 32% at a typical US workplace, per Great Place To Work (2024-2025).
- Fortune 100 Best Companies generate 8.5 times more revenue per employee than the US market average, $883,928 against $104,030, according to Great Place To Work (2025).
AI, job security, and engagement
AI on its own does not raise or lower engagement, but the way leaders introduce it does. The same pattern shows up in Gallup’s US data and in ADP’s global survey.
- 65% of US workers in organizations that implemented AI say it had a positive impact on their individual productivity, while only 12% strongly agree it transformed how work gets done, per Gallup (2026).
- 18% of US employees say their job is very or somewhat likely to be eliminated in five years by technology, rising to 23% where AI has been implemented, according to Gallup (2026).
- 89% of leaders in a recent NBER survey report no impact of AI on company labor productivity in the past three years, though they expect a 1.4% gain over the next three, per Gallup (2026).
- Engagement is 6 points higher in organizations that adopted AI, 15 points higher where there is a clear AI plan, and 18 points higher where managers actively support AI use, according to Gallup (July 2026).
- Engagement reaches 53% when frequent AI use, a clear plan, and active manager support all come together, per Gallup (July 2026).
- Weekly AI users give AI the top productivity rating at 24%, against 5% for less frequent users, according to Gallup (July 2026).
- Only 22% of workers worldwide strongly agree their job is safe from elimination, in ADP Research’s 2026 release, as reported by InvestingNews (2026).
- Workers who feel their jobs are safe are 6 times more likely to be fully engaged, 3.3 times more likely to say they are highly productive, and 2 times more likely to say they will not leave, per ADP Research (2026).
- Workers who find meaning in their jobs are 12.5 times more likely to be fully engaged, according to ADP Research (2026).
- 30% of workers who use AI daily are fully engaged, against 14% who never use AI, per ADP Research (2026).
- 62% of workers put in up to 5 unpaid hours a week, and 38% put in 6 or more, according to ADP Research (2026).
- Brazil had the highest engagement at 29% and China the lowest at 11% in ADP’s 2025 survey, per ADP Research (2026).
What the numbers mean
The numbers point to one lever above all: the manager. Engagement falls when managers lose clarity, support, and time, and it rises where managers set clear expectations, back new tools, and show they care.
The benefits of collaboration at work show the same pattern from the team side.
Our guide on how to improve team collaboration covers the habits that support it.
A worked example makes the scale concrete. Imagine a 200-person company at the global average: 40 people are engaged, 128 are not engaged, and 32 are actively disengaged. If that company reached the 70% engagement of Gallup’s best-practice workplaces, 140 people would be engaged instead of 40. This is an illustration from published rates, not a promise.
The second lesson is about measurement. Gallup and ADP disagree by a point on the global rate because they ask different questions, and both are honest about it. Pick one survey, track it the same way each quarter, and judge progress against your own baseline.
Our guide on psychological safety at work explains one of the conditions that moves the numbers.
The workplace collaboration statistics page puts engagement next to the wider collaboration data.
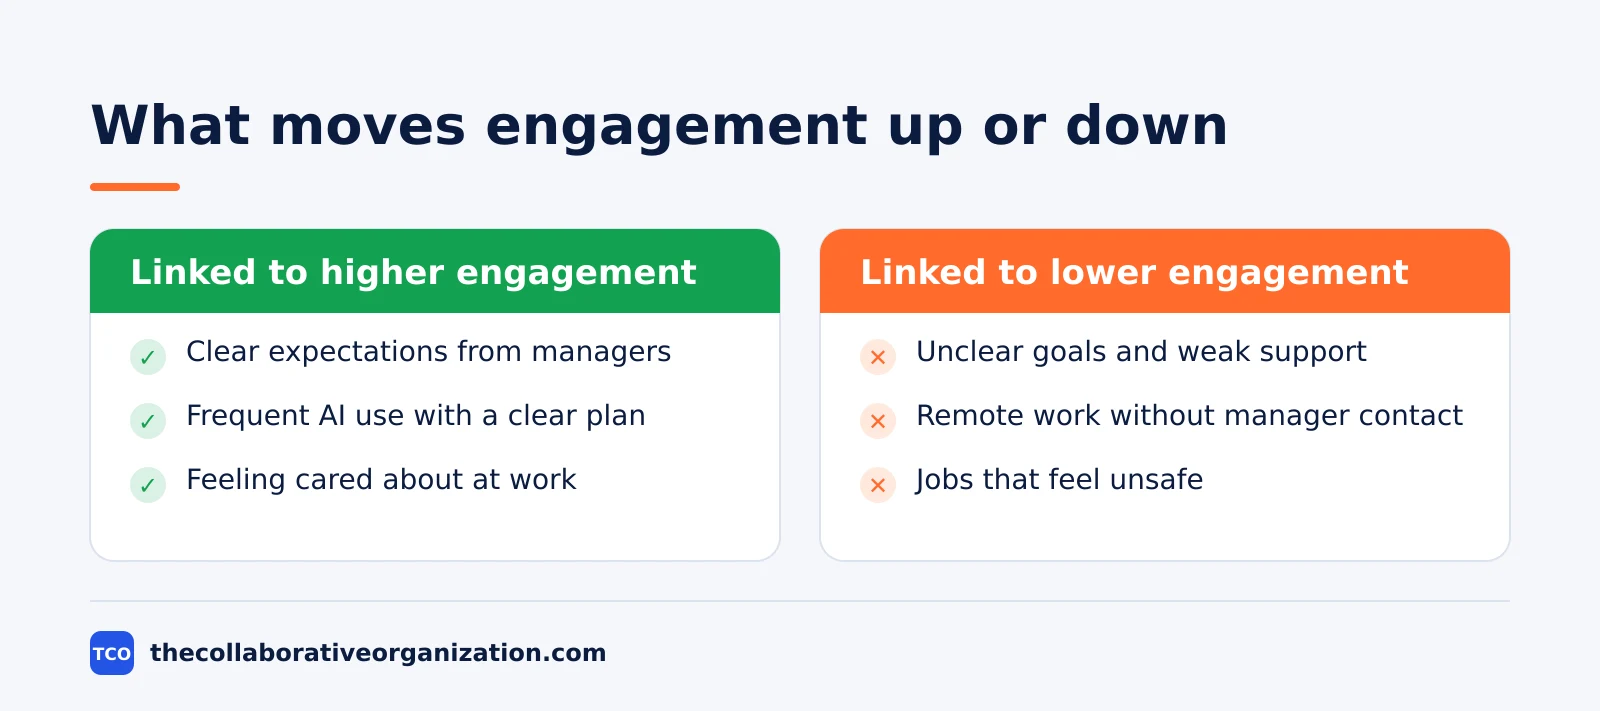
The third lesson is that AI is a test of management, not of technology. Engagement rose where leaders gave a clear plan and managers backed daily use, and it fell where tools arrived with no plan.
If your team is adopting AI, compare notes with our guide on how to choose team communication software.
The team communication software shortlist lists the options before you add another tool to the stack.
Employee engagement statistics table
The table below gathers the key figures in one place, grouped by theme, with the source and year for each. Use it to check a number before you quote it.
| Statistic | Source | Year |
|---|---|---|
| 20% of employees worldwide engaged | Gallup, State of the Global Workplace | 2025 |
| 64% not engaged, 16% actively disengaged worldwide | Gallup, State of the Global Workplace | 2025 |
| 23% global engagement peak | Gallup, State of the Global Workplace | 2022 |
| $10 trillion lost productivity, 9% of GDP | Gallup, State of the Global Workplace | 2025 |
| 52% say it is a good time to find a job | Gallup, State of the Global Workplace | 2025 |
| 34% of employees thriving worldwide | Gallup, State of the Global Workplace | 2025 |
| 22% of managers engaged worldwide | Gallup, State of the Global Workplace | 2025 |
| 79% of managers engaged in best-practice workplaces | Gallup, State of the Global Workplace | 2025 |
| 31% of US employees engaged, first half | Gallup, US engagement | 2026 |
| 29% of US employees engaged, third quarter | Gallup, US engagement | 2026 |
| 36% US engagement peak | Gallup, US engagement | 2020 |
| $2 trillion annual US cost of low engagement | Gallup, US engagement | 2026 |
| 49% know what is expected of them at work | Gallup, US engagement | 2026 |
| 46% know what is expected, third quarter | Gallup, US engagement | 2026 |
| 37% feel someone at work cares about them | Gallup, US engagement | 2026 |
| 53% engagement with AI use, plan, and manager support | Gallup, US engagement | 2026 |
| 81% lower absenteeism, top vs bottom quartile | Gallup, Q12 meta-analysis | 2020 |
| 23% higher profitability, top vs bottom quartile | Gallup, Q12 meta-analysis | 2020 |
| 18% higher productivity, top vs bottom quartile | Gallup, Q12 meta-analysis | 2020 |
| 43% lower turnover, low-turnover organizations | Gallup, Q12 meta-analysis | 2020 |
| 10% higher customer loyalty, top vs bottom quartile | Gallup, Q12 meta-analysis | 2020 |
| 19% fully engaged worldwide | ADP Research, People at Work | 2025 |
| 56% work on site every day | ADP Research, People at Work | 2024 |
| 25% fully engaged, Middle East and Africa | ADP Research, People at Work | 2024 |
| 22% strongly agree their job is safe | ADP Research, Today at Work | 2026 |
| 12.5 times more likely engaged with meaningful work | ADP Research, Today at Work | 2026 |
| 30% fully engaged among daily AI users | ADP Research, Today at Work | 2026 |
| 85% give extra effort at Certified companies | Great Place To Work | 2024 |
| 12% voluntary turnover at Certified companies | Great Place To Work | 2024 |
| 8.5 times more revenue per employee, Fortune 100 Best | Great Place To Work | 2025 |
Common employee engagement statistics mistakes to avoid
Most engagement statistics go wrong in the same five ways, and all five come from quoting a number without its source, year, or survey. Run through the list before you cite a figure.
- Quoting the old $8.8 trillion cost. That figure comes from Gallup’s 2023 report on 2022 data, and the current estimate is $10 trillion for 2025.
- Mixing Gallup and ADP rates. The two surveys ask different questions, so do not average them or present one as the other.
- Treating an association as proof. Gallup’s meta-analysis shows engaged units perform better, but it does not prove engagement alone caused each gain.
- Citing a single quarter as a trend. US engagement fell to 29% in one quarter of 2026, which is a sharp move, but one quarter does not set the trend.
- Quoting a stat with no year. Engagement moves every year, so a number without its year is out of date the moment it is printed.
Sources
- Gallup - State of the Global Workplace 2026 (2026)
- Gallup - Employee Engagement Remains Flat as AI Adoption Accelerates (2026)
- Gallup - U.S. Employee Engagement Below 30% for First Time in 15 Years (2026)
- Gallup - The Benefits of Employee Engagement (2026)
- ADP Research - People at Work 2025: A Global Workforce View (2025)
- ADP Research - Worker Engagement Is on the Rise (2025)
- ADP Research - Today at Work 2026, Issue 1 (2026)
- Great Place To Work - Employee Engagement Strategies and Software (2025)
Frequently asked questions
What percentage of employees are engaged at work in 2026?
Gallup puts global engagement at 20% in 2025, its lowest level since 2020, and US engagement at 29% in the third quarter of 2026, the lowest since 2011. ADP Research, which uses a different survey, puts full engagement at 19% worldwide in 2025. The two surveys ask different questions, so the numbers differ, but both point the same way: most workers are not engaged.
How much does low engagement cost?
Gallup estimates low engagement cost the world economy about $10 trillion in lost productivity in 2025, or about 9% of global GDP. In the United States alone, the cost is about $2 trillion a year. These are modeled estimates of lost output, not cash on a balance sheet, so treat them as a measure of scale rather than an exact bill.
Do engaged teams really perform better?
Yes, in Gallup's data. Its 2020 meta-analysis of 456 studies found top-quartile business units had 81% lower absenteeism, 23% higher profitability, and 18% higher productivity than bottom-quartile units. The link is a strong association across many studies, not proof that engagement alone causes each gain, but the pattern holds across industries and countries.
Why is manager engagement falling?
Gallup's 2026 global report puts manager engagement at 22% in 2025, down from 31% in 2022, with the largest single-year drop in the series. Managers carry more change, larger teams, and AI rollout, while support and training have not kept pace. In best-practice workplaces, 79% of managers are engaged, which shows the drop is not fixed.
How is employee engagement measured?
Gallup sorts workers into engaged, not engaged, and actively disengaged from their answers to 12 workplace questions, known as the Q12, and runs the survey through its World Poll in more than 140 countries plus quarterly US panels. ADP Research asks workers directly whether they feel fully engaged in its annual Global Workforce Survey of about 39,000 workers in 36 markets.
Related articles
team communication
Communication Plan for a Project: Template (2026)
A communication plan for a project names who gets which update, in which channel, how often, and from whom. Copy the template and the filled example below.
November 20, 2026 · 10 min read
team communication
How Often Should Managers Communicate With Teams? (2026)
Managers should hold one meaningful conversation with each person every week, plus a weekly team update. See the cadence table for meetings, updates and feedback.
November 20, 2026 · 9 min read
team communication
Upward Communication Examples: 10 That Work (2026)
Upward communication is a message that travels from an employee to a manager or leader. See 10 concrete examples, each with why it works and when to use it.
November 20, 2026 · 9 min read