Employee Burnout Statistics: 25+ Verified Figures (2026) | The Collaborative Organization
By The Collaborative Organization Team · November 19, 2026 · Last verified November 19, 2026 · 12 min read
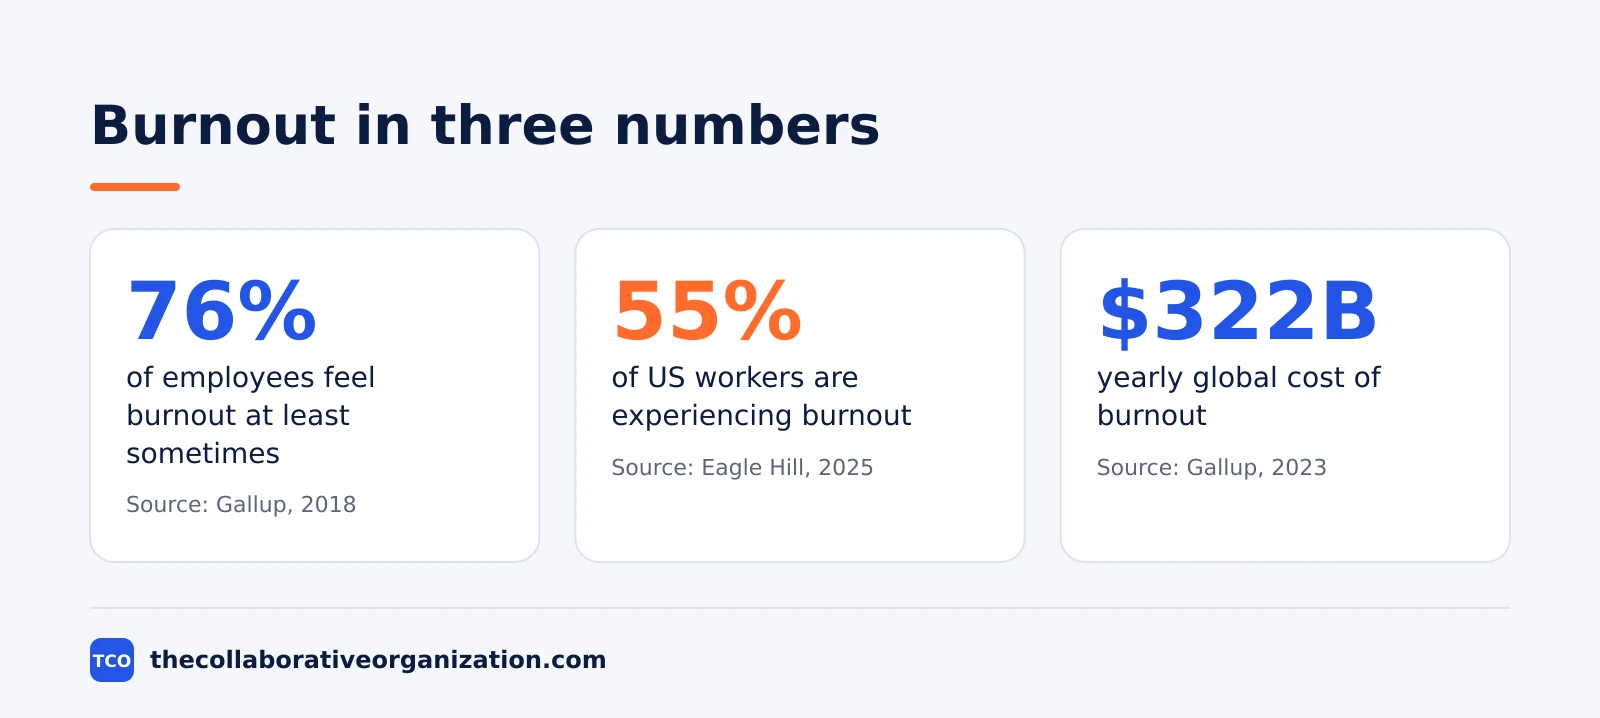
Employee burnout is common, costly and uneven: 55% of US workers were experiencing burnout in November 2025, according to Eagle Hill Consulting, and Gallup found 76% of employees feel burned out at least sometimes. The numbers below come from the original reports, not from roundups. Each figure names its source and its year, so you can check it yourself.
Key takeaways
- Gallup found 76% of employees experience burnout at least sometimes, and 23% feel it very often or always.
- Eagle Hill found 55% of US workers experiencing burnout in November 2025, with Gen Z highest at 66%.
- Women report burnout more often than men: 31% against 23% in Gallup’s late-2025 data.
- Gallup puts the global cost of burnout-linked turnover and lost productivity at $322 billion a year.
- Burned-out employees are 2.6 times as likely to be actively looking for a new job, Gallup found.
- Unfair treatment is the strongest single predictor of burnout, at 2.3 times the risk.
What burnout is, and what it is not
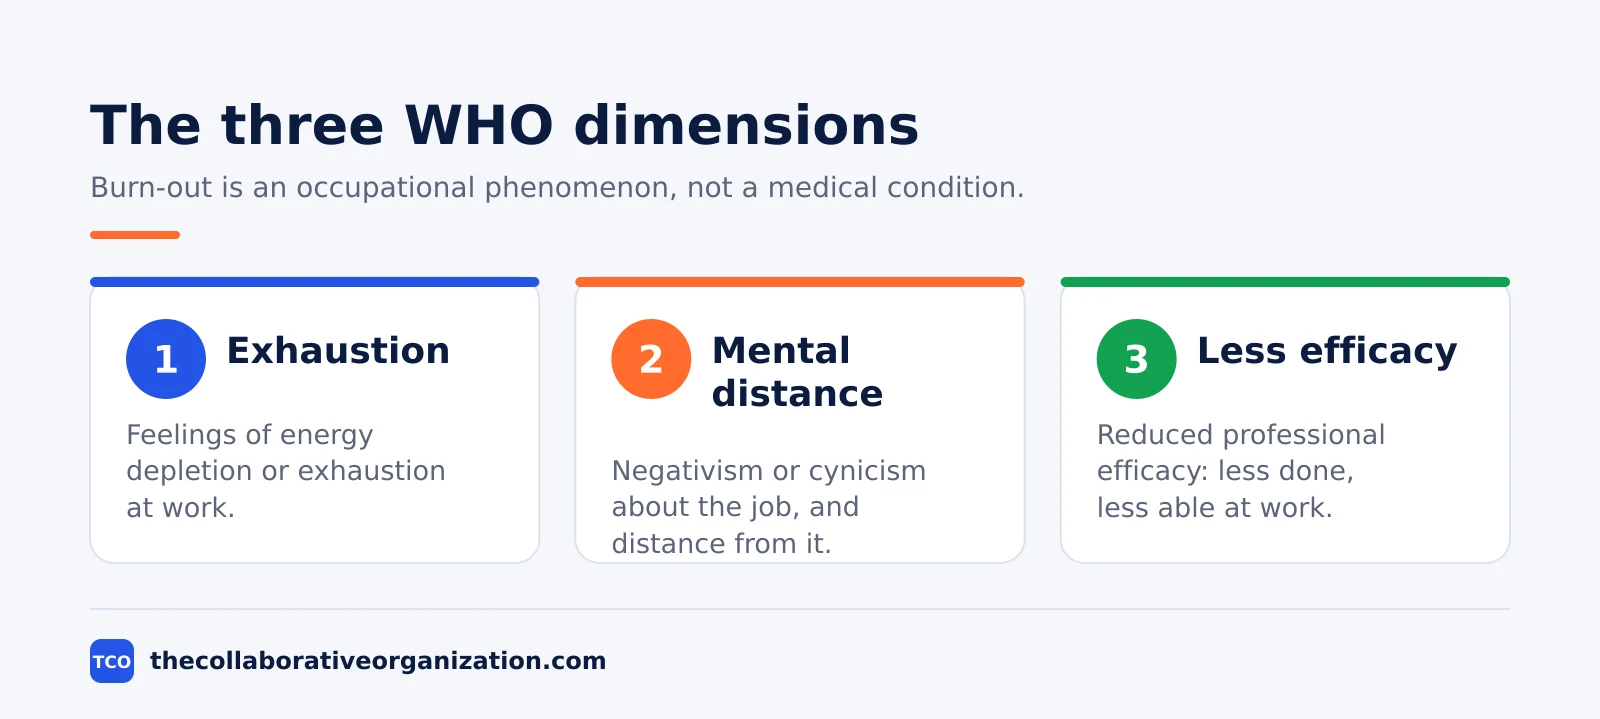
Burnout is a work problem with a formal definition, not a synonym for being tired. The World Health Organization lists burn-out in ICD-11 as an occupational phenomenon, not a medical condition. Its definition, published in 2019, calls it a syndrome from chronic workplace stress that has not been managed well.
The definition has three parts. The first is feelings of energy depletion or exhaustion. The second is increased mental distance from the job, or feelings of negativism or cynicism about it. The third is reduced professional efficacy, which means the person gets less done and feels less able at work.
The WHO also sets a clear limit on the term. Burn-out refers to the occupational context only, and it should not be used to describe experiences in other areas of life. That matters when you read surveys: a study that asks about work stress measures something different from one that asks about life in general.
How common is burnout at work
Most workers have felt burnout, and about one in four US workers feels it often. Gallup studied nearly 7,500 full-time employees and found 23% reported feeling burned out very often or always, while a further 44% reported feeling burned out sometimes. Together, that is 76% who experience burnout at least sometimes.
A simpler question gives a lower number. Eagle Hill Consulting asked US workers in November 2025 whether they are experiencing burnout and found 55% said yes. The survey covered more than 1,400 full-time employees and has run since 2020, so the wording has stayed the same across years.
Other large surveys land in the same range. SHRM surveyed 1,405 US workers in early 2024 and found 44% feel burned out at work, 45% feel emotionally drained, and 51% feel used up at the end of the workday.
Microsoft surveyed 31,000 people in 31 countries in 2024 and found 46% feel burned out, while 68% struggle with the pace and volume of work.
Stress sits close behind burnout in every survey. The Aflac WorkForces Report for 2025-2026 found 72% of US employees face moderate to very high stress at work, a six-year high. The APA found 67% of US workers reported at least one burnout-related outcome in the past month in its 2024 survey, such as low energy or lack of effort.
Who burns out the most
Burnout hits younger workers and women hardest, and the gap is widest at the top. In Gallup data from late 2025, 31% of women in full-time work said they very often or always feel burned out, against 23% of men. The same gap shows up among parents: 33% of women with children against 25% of men with children.
Leadership does not protect women from burnout. From 2022 through 2025, an average of 29% of women in leadership roles reported burnout, against 19% of men in the same roles. Among managers, the gap is 34% of women against 27% of men. Gallup notes the pattern has stayed stable across the four-year period.
Age shows the same tilt. Eagle Hill found 66% of Gen Z workers experiencing burnout in 2025, followed by 58% of millennials, 53% of Gen X and 37% of baby boomers. Aflac found a similar order: 74% of Gen Z workers reported at least moderate burnout, against 66% of millennials.
The Deloitte 2025 Gen Z and Millennial Survey, covering 23,482 people in 44 countries, found 34% of millennials feel stressed or anxious all or most of the time. About one-third of them said their job is a major source of stress. Long working hours, lack of recognition and toxic workplaces drive the stress, the survey found.
What causes burnout
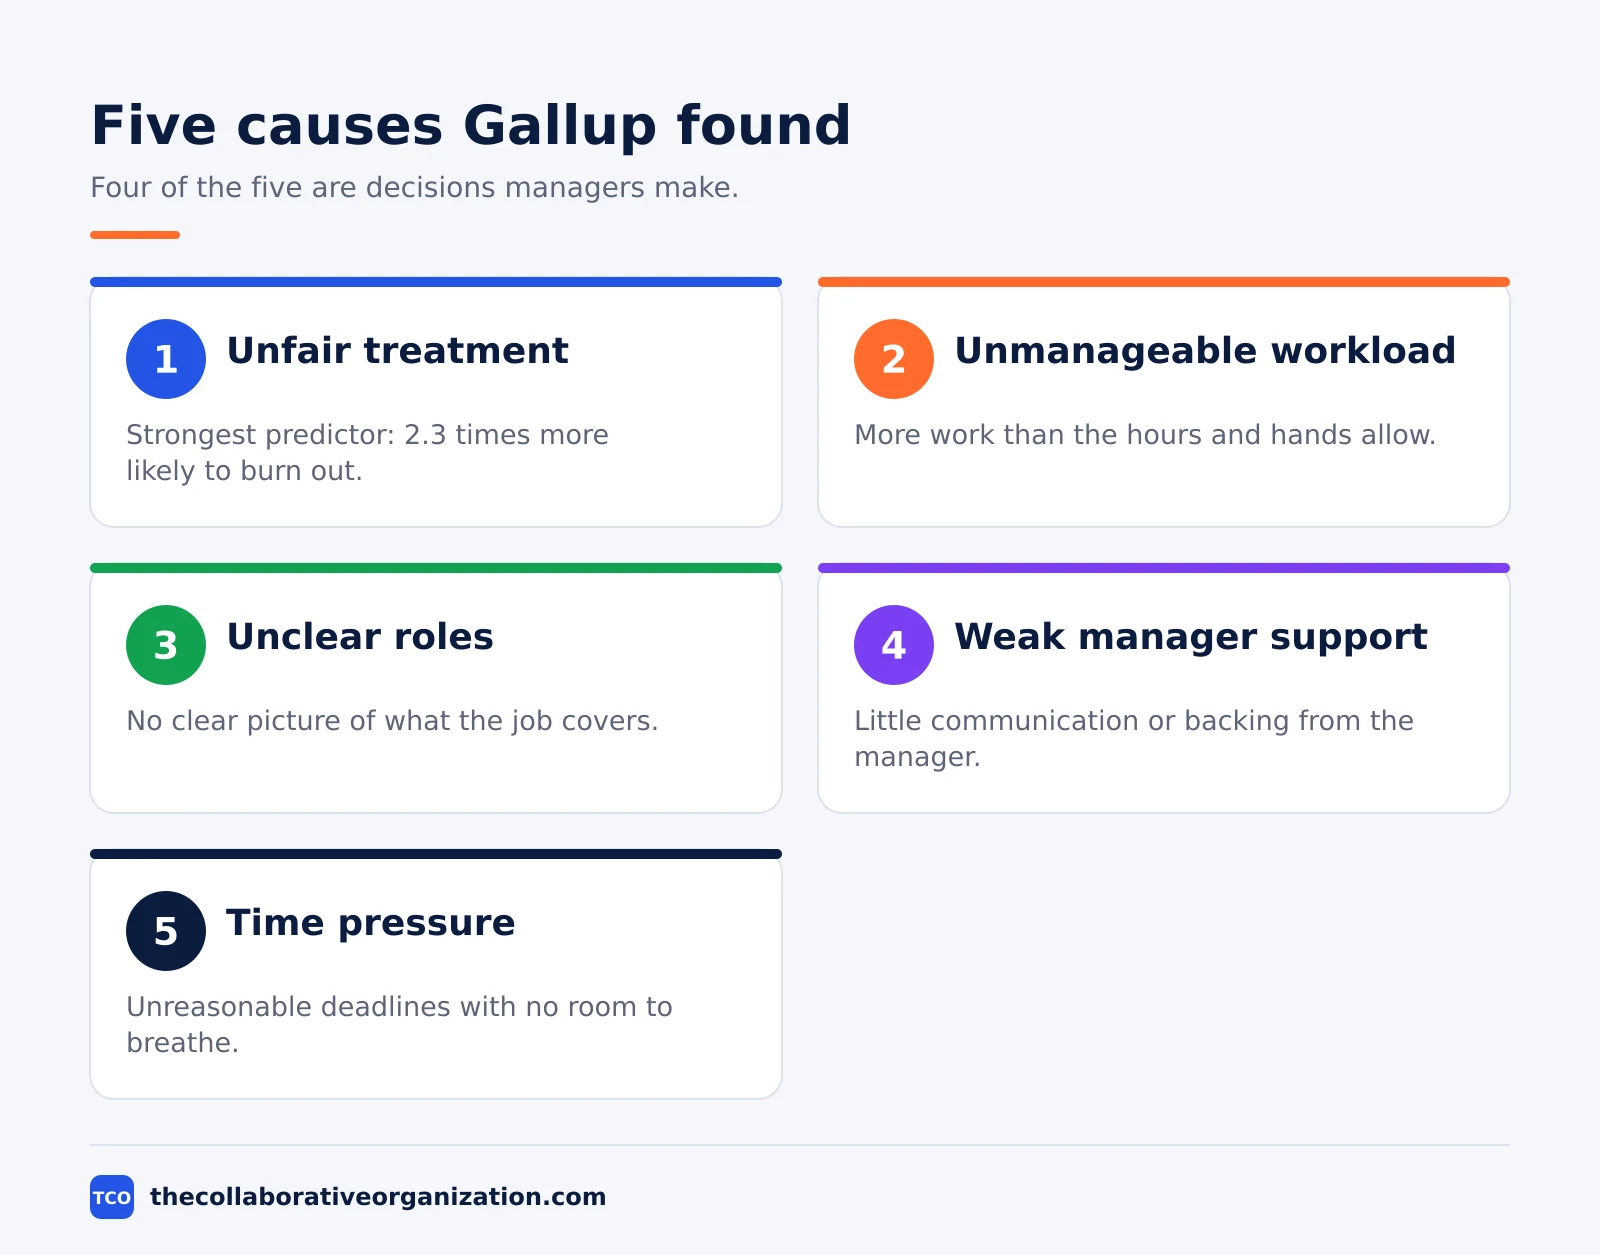
Gallup names five causes, and four of them are management decisions. The Gallup list is unfair treatment at work, unmanageable workload, lack of role clarity, lack of communication and support from a manager, and unreasonable time pressure. Unfair treatment is the strongest single predictor: employees who feel treated unfairly are 2.3 times more likely to experience high burnout.
Workload and time pressure work together. Employees who say they often or always have enough time to do their work are 70% less likely to experience high burnout, Gallup found. SHRM found 44% of burned-out employees report that their workload is unreasonably high, and more than 61% leave work feeling physically and emotionally drained.
Job insecurity adds a newer cause. In the APA 2025 survey, 54% of US workers said job insecurity significantly affects their stress, and 44% were concerned an economic downturn would cost them their job in the next 12 months, up from 36% in 2024.
Low psychological safety makes it worse: 61% of workers with lower psychological safety said they typically feel tense or stressed during the workday, against 43% of workers overall.
What burnout costs employers
Burnout is expensive because it drives absence, quits and lost output at the same time. Gallup puts the global cost of burnout-linked turnover and lost productivity at $322 billion a year. That works out to about $20 million in lost opportunity per 10,000 employees, and 15% to 20% of payroll lost each year to voluntary turnover driven by burnout alone.
The people effects behind the money are stark. Employees who experience burnout very often or always are 63% more likely to take a sick day and 2.6 times as likely to be actively seeking a different job, Gallup found in its 2018 study.
They are also 13% less confident in their performance, and 23% more likely to visit the emergency room.
SHRM found the same quit pattern. Burned-out workers are nearly three times more likely to be actively searching for another job: 45% against 16% of workers who are not burned out. Globally, SHRM found burned-out employees are three times more likely to leave their jobs than engaged colleagues, and more than 30% of employees worldwide reported being burned out.
Burnout also cuts the quality of the work that stays. Eagle Hill found 72% of burned-out workers say their efficiency is lower, 71% say overall job performance falls, and 65% say customer service suffers.
The same survey found 64% say innovation drops and 56% report attendance issues. Microsoft found 46% of workers worldwide were considering quitting in the year ahead in 2024, an all-time high since the Great Reshuffle of 2021.
The wider economy feels it too. Gallup found global employee engagement fell from 23% to 21% in 2024, and the decline alone cost $438 billion in lost productivity. Disengagement in total costs the world $8.9 trillion a year, Gallup estimated in its 2025 report.
Employee burnout statistics table
The table below lists 30 statistics from the reports above, grouped by theme, with the source and the year for each one.
| Statistic | Source | Year |
|---|---|---|
| 76% of employees experience burnout at least sometimes | Gallup | 2018 |
| 23% feel burned out very often or always | Gallup | 2018 |
| 44% feel burned out sometimes | Gallup | 2018 |
| 55% of US workers are experiencing burnout | Eagle Hill | 2025 |
| 44% of US workers feel burned out at work | SHRM | 2024 |
| 51% feel used up at the end of the workday | SHRM | 2024 |
| 45% feel emotionally drained from work | SHRM | 2024 |
| 46% of workers feel burned out | Microsoft | 2024 |
| 72% face moderate to very high stress at work | Aflac | 2025 |
| 67% reported a burnout-related outcome in the past month | APA | 2024 |
| 40% of global workers felt a lot of stress the previous day | Gallup | 2025 |
| 21% of global workers are engaged at work | Gallup | 2025 |
| 31% of women vs 23% of men burned out very often or always | Gallup | 2025 |
| 29% of women leaders vs 19% of men leaders burned out | Gallup | 2025 |
| 34% of women managers vs 27% of men managers burned out | Gallup | 2025 |
| 66% of Gen Z workers experiencing burnout | Eagle Hill | 2025 |
| 58% of millennials experiencing burnout | Eagle Hill | 2025 |
| 37% of baby boomers experiencing burnout | Eagle Hill | 2025 |
| 74% of Gen Z report at least moderate burnout | Aflac | 2025 |
| 34% of millennials stressed or anxious all or most of the time | Deloitte | 2025 |
| Unfair treatment makes high burnout 2.3 times more likely | Gallup | 2018 |
| Enough time to do the work cuts high burnout risk by 70% | Gallup | 2018 |
| 54% say job insecurity significantly affects their stress | APA | 2025 |
| 43% typically feel tense or stressed during the workday | APA | 2024 |
| $322 billion a year in burnout-linked turnover and lost productivity | Gallup | 2023 |
| $20 million lost opportunity per 10,000 employees | Gallup | 2023 |
| 63% more likely to take a sick day when burned out often | Gallup | 2018 |
| 2.6 times as likely to be actively seeking a new job | Gallup | 2018 |
| 45% of burned-out workers actively job searching vs 16% | SHRM | 2024 |
| $438 billion lost as global engagement fell in 2024 | Gallup | 2025 |
What the numbers mean
The numbers point at the job, not at the worker. The WHO definition puts the cause in chronic workplace stress that has not been managed, and Gallup’s five causes are mostly things managers control: fair treatment, workload, clear roles, support and time. That is why the same surveys that report high burnout also report fixes that sit with leaders, not with meditation apps.
The gender and age gaps also point at work design. Women report higher burnout and higher engagement at the same time, Gallup found in late 2025, which suggests effort is high while support lags. Younger workers report the highest burnout in every survey, which fits with less control over their calendars.
Our guide on how to build psychological safety in a team covers the support side: how leaders give people room to speak up and ask for help. Feeling safe to raise a problem early keeps small strains from growing into burnout.
Two numbers deserve extra care. The $322 billion Gallup figure is a modelled estimate from turnover and lost productivity, not money counted from company accounts. The 71% productivity rise in meeting-free day studies is a self-reported rating, not measured output.
Treat both as direction, not as a budget line. For the wider picture, see our workplace collaboration statistics, which track meeting load and message volume with the same source-first method.
How we chose these stats
We took every number in this article from the publisher’s own report, press release or dataset, and we checked each one against that source on 19 November 2026. We used the latest edition of each yearly report that includes the figure. Vendor surveys are flagged as vendor surveys, and modelled estimates are flagged as estimates.
The sources are the WHO (2019), Gallup (2018, 2023 and 2025), SHRM (2024), Eagle Hill (2025), Aflac (2025), the APA (2024 and 2025), Deloitte (2025) and Microsoft (2024). Figures from different surveys should not be averaged or combined, because each survey asks a different question of a different group.
When two surveys disagree, the wording usually explains why. For help acting on the numbers, compare the options on our team communication software shortlist.
Common mistakes when reading burnout statistics
The most common mistake is comparing numbers that measure different things. A survey that asks whether workers feel burned out “very often or always” will always score lower than one that asks whether they are experiencing burnout at all. Gallup’s 23% and Eagle Hill’s 55% both describe the US workforce, and both are right, because they ask different questions.
A second mistake is treating a single survey as a trend. Burnout rates move slowly, so one new survey does not show a crisis getting worse or better on its own. Look for the same question asked the same way over several years, as Eagle Hill and Gallup both do.
A third mistake is quoting a modelled cost as cash. The $322 billion and $438 billion figures are estimates built from survey rates, pay and headcount. They show scale, not a bill.
Use them to argue for action, not to promise a precise saving. New hires face the same risk, so onboarding statistics are worth reading alongside this page.
To cut the meeting load that feeds burnout, read our guide on how to improve team collaboration.
Sources
- WHO - Burn-out an occupational phenomenon (2019)
- Gallup - Employee Burnout, Part 1: The 5 Main Causes (2018)
- Gallup - Women Show Stronger Engagement Amid Higher Burnout (2026)
- Gallup - State of the Global Workplace 2025 Report (2025)
- Gallup - Employee Wellbeing and Sustainable Productivity (2025)
- SHRM - Here Is How Bad Burnout Has Become at Work (2024)
- SHRM - Burnout Is Not Personal, It Is Cultural (2025)
- Eagle Hill Consulting - More Than Half of US Workers Report Burnout (2025)
- Aflac - American Workforce Burnout Reaches 6-Year High (2025)
- APA - Work in America 2025 (2025)
Frequently asked questions
What percentage of employees experience burnout?
It depends on the question asked. Gallup found 76% of employees experience burnout at least sometimes, and 23% feel it very often or always. Eagle Hill asked a simpler question in November 2025 and found 55% of US workers are experiencing burnout. The stricter the wording, the lower the number, so always check how the survey asked it.
What are the main causes of employee burnout?
Gallup names five causes: unfair treatment at work, unmanageable workload, lack of role clarity, weak manager support, and unreasonable time pressure. Unfair treatment is the strongest single predictor, with affected employees 2.3 times more likely to report high burnout. Four of the five causes are decisions managers make, not traits employees bring with them.
Which workers burn out the most?
Younger workers and women report the highest rates. Eagle Hill found 66% of Gen Z workers and 58% of millennials experiencing burnout in 2025, against 37% of baby boomers. Gallup found 31% of women and 23% of men feeling burned out very often or always in late 2025, with the gap widest among leaders.
What does burnout cost employers?
Gallup puts the global cost of burnout-linked turnover and lost productivity at $322 billion a year, or about $20 million in lost opportunity per 10,000 employees. Burned-out employees are 2.6 times as likely to be actively looking for a new job and 63% more likely to take a sick day, so the cost shows up in hiring, absence and lost output.
Is burnout a medical condition?
No. The World Health Organization lists burn-out in ICD-11 as an occupational phenomenon, not a medical condition. It defines it as a syndrome from chronic workplace stress that has not been managed well, with three parts: exhaustion, mental distance from the job, and reduced professional efficacy. It applies to work only.
How were these statistics chosen?
Every number here comes from the original publisher: Gallup, SHRM, the APA, Eagle Hill, Aflac, Deloitte, Microsoft or the WHO. Each figure names its source and year, and most link to the original report. We left out figures we could not trace to a published study, and we flag where a number is self-reported or a modelled estimate.
Related articles

team communication
Communication Plan for a Project: Template (2026)
A communication plan for a project names who gets which update, in which channel, how often, and from whom. Copy the template and the filled example below.
November 20, 2026 · 10 min read
team communication
How Often Should Managers Communicate With Teams? (2026)
Managers should hold one meaningful conversation with each person every week, plus a weekly team update. See the cadence table for meetings, updates and feedback.
November 20, 2026 · 9 min read
team communication
Upward Communication Examples: 10 That Work (2026)
Upward communication is a message that travels from an employee to a manager or leader. See 10 concrete examples, each with why it works and when to use it.
November 20, 2026 · 9 min read