SaaS Statistics: 40 Numbers on Spend, Apps and Waste (2026) | The Collaborative Organization
By The Collaborative Organization Team · November 19, 2026 · Last verified November 19, 2026 · 12 min read
SaaS statistics for 2026 show a market that keeps growing, stacks that keep expanding, and waste that refuses to shrink. Worldwide SaaS revenue is forecast at $488.5 billion in 2026, app counts run from 118 to 305, and only 54% of licenses are used. This guide collects 40 verified numbers, each with its original source.
Key takeaways
- Worldwide SaaS revenue is forecast at $488.5 billion in 2026, up 21.9% on the year (Statista).
- App counts range from 118 per company (BetterCloud, 2026) to 305 (Zylo, 2026), because each source measures a different population.
- The average company spends $55.7 million a year on SaaS, and only 54% of its licenses are used (Zylo, 2026).
- SaaS prices rose 16.4% in the year to June 2026, a record high (Vertice).
- Shadow IT now touches nearly half of all apps: only 56% carry IT approval (BetterCloud, 2026).
SaaS market size and growth
The SaaS market is worth about $488.5 billion in 2026, and it is still growing fast. Statista forecasts 21.9% growth on the year, with revenue reaching $855.6 billion by 2031 at an 11.9% compound annual growth rate, and $254.9 billion of the 2026 total coming from the United States.
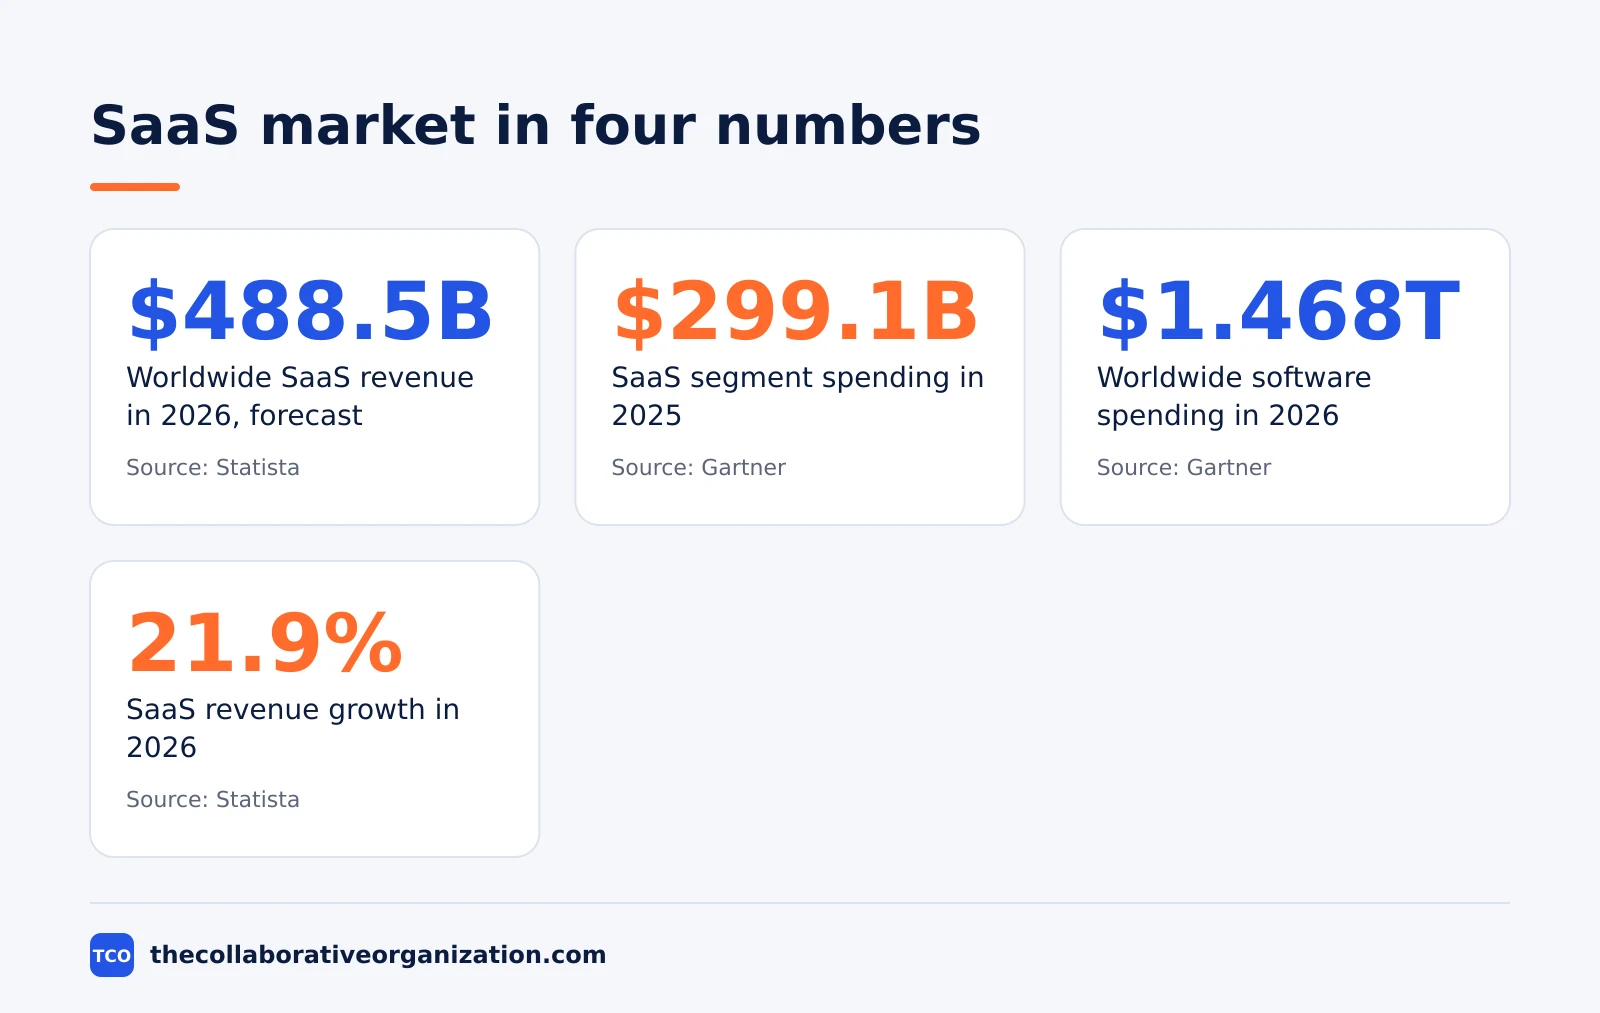
Gartner puts the SaaS segment at $299.1 billion in 2025, up 19.2% on 2024, inside $723.4 billion of public cloud spending. The gap between the two figures is scope: Gartner counts cloud application services, while Statista counts the wider SaaS market.
Software spending tells the wider story. Gartner forecasts worldwide software spending of $1.468 trillion in 2026, up 15.5% on 2025, inside $6.37 trillion of total IT spending.
AI spending runs alongside the SaaS numbers. BetterCloud reports Gartner’s forecast of worldwide AI spending at $2.59 trillion in 2026, up 47% on the year. AI features now appear as paid add-ons inside tools companies already own.
If you are buying rather than benchmarking, start with our guide on how to evaluate SaaS software, which sets out the checks that keep a new tool from becoming another idle license.
How many SaaS apps companies run
The honest answer is a range: 118 to 305 apps per company, and the gap comes from who is counting. BetterCloud, surveying 525 IT and security professionals, puts the average at 118 apps in 2026, up 11% on 106 in 2025. Mid-sized firms jumped 41% in a year, from 116 to 164 apps.
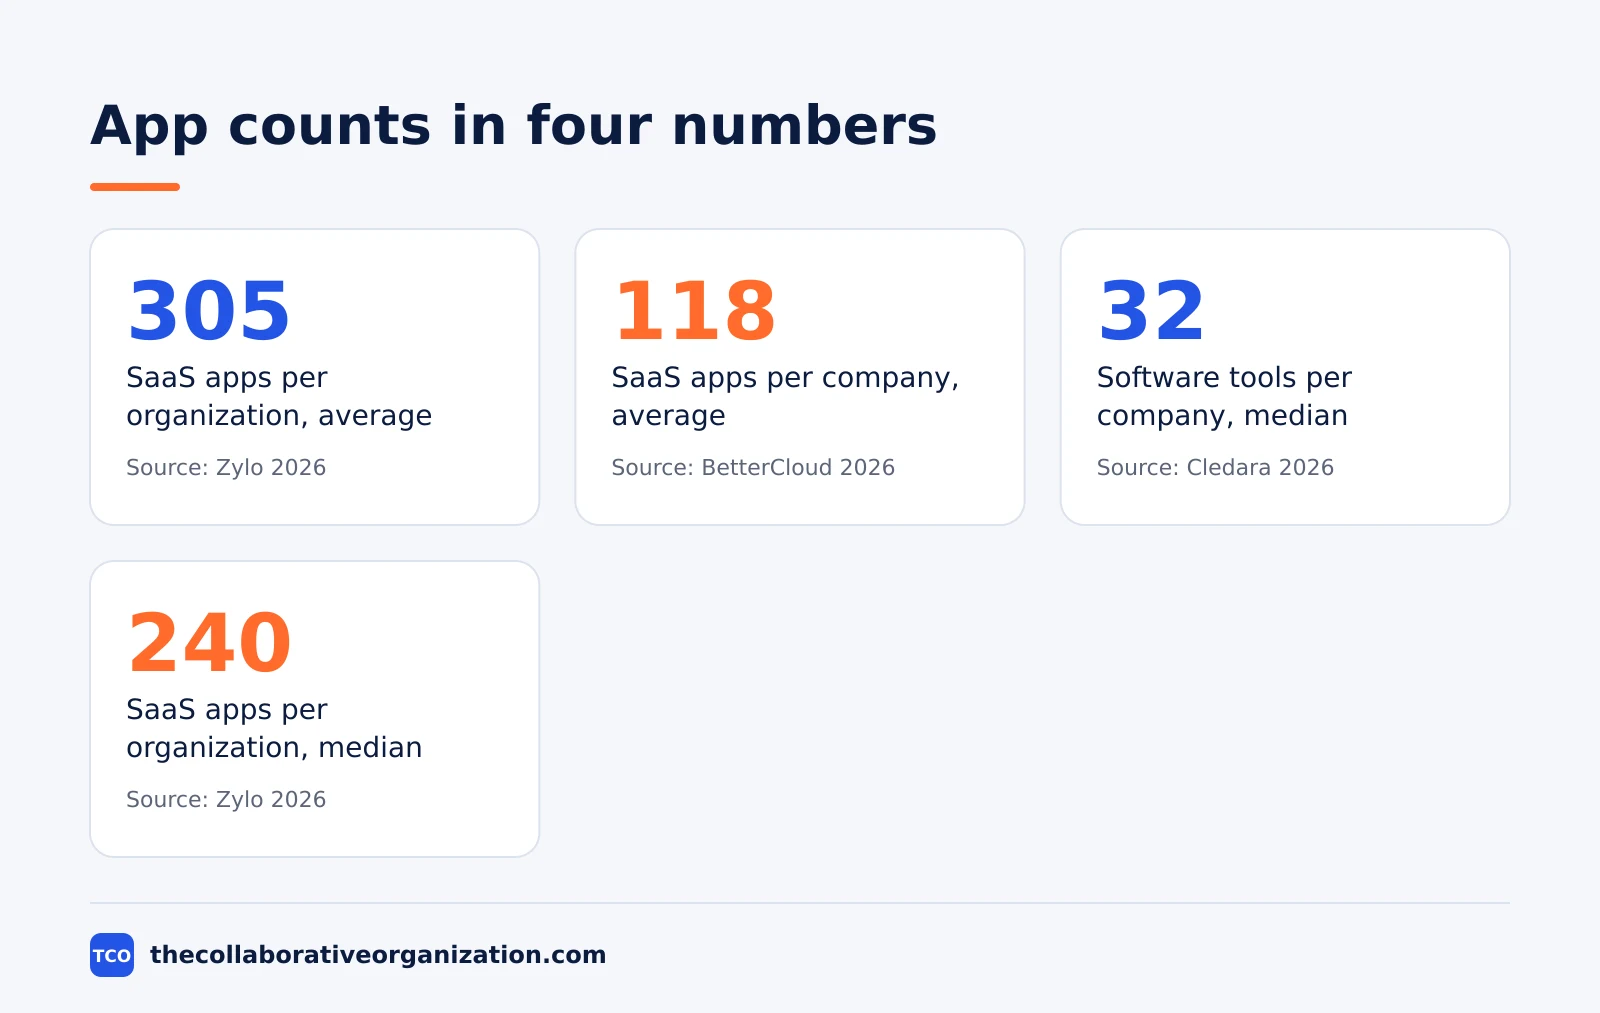
Zylo counts a different population: large enterprise portfolios under its management. Its 2026 index puts the average at about 305 applications, with a median of 240, and average spend of $55.7 million a year.
Cledara counts small and mid-sized paying customers, and its 2026 benchmarks put the median company at 32 software tools. The gap between 32 and 305 is company size, not error.
Vertice tracks spend across vendors and puts the number of SaaS apps per business at 144, a record level. Four sources, four populations, one lesson: always name the population with the count.
The count is not standing still. Zylo reports that large enterprises add an average of 21 applications a month, and the average portfolio grows about 34% a year, adding roughly nine apps a month.
The trend reversed in 2026. BetterCloud counts 8 apps per company in 2015, then two years of consolidation: down 14% in 2024 and 5% in 2025, before the 11% rise in 2026.
Our guide to software adoption statistics puts app counts next to adoption rates, so you can see which tools teams actually open.
SaaS spend per employee and waste
Spend per employee is the fairest way to compare companies, and the 2026 range runs from about $1,741 to $9,455. Cledara, surveying 200 tech companies, found startups with up to 20 staff spend about $8,000 per employee, while firms with 100 to 200 staff spend $1,741.
Zylo puts the average at $4,830 per employee in 2025, up 21.9% in a year, and its 2026 median is $9,455. The two figures measure different things: an average across all sizes against a median that limits the pull of the largest portfolios.
Vertice tracks a similar climb: about $9,300 per employee in 2026, up from $9,100 in 2025 and $8,700 in 2024. Three separate datasets now put the figure near $9,000 to $9,500, which makes it a usable planning range.
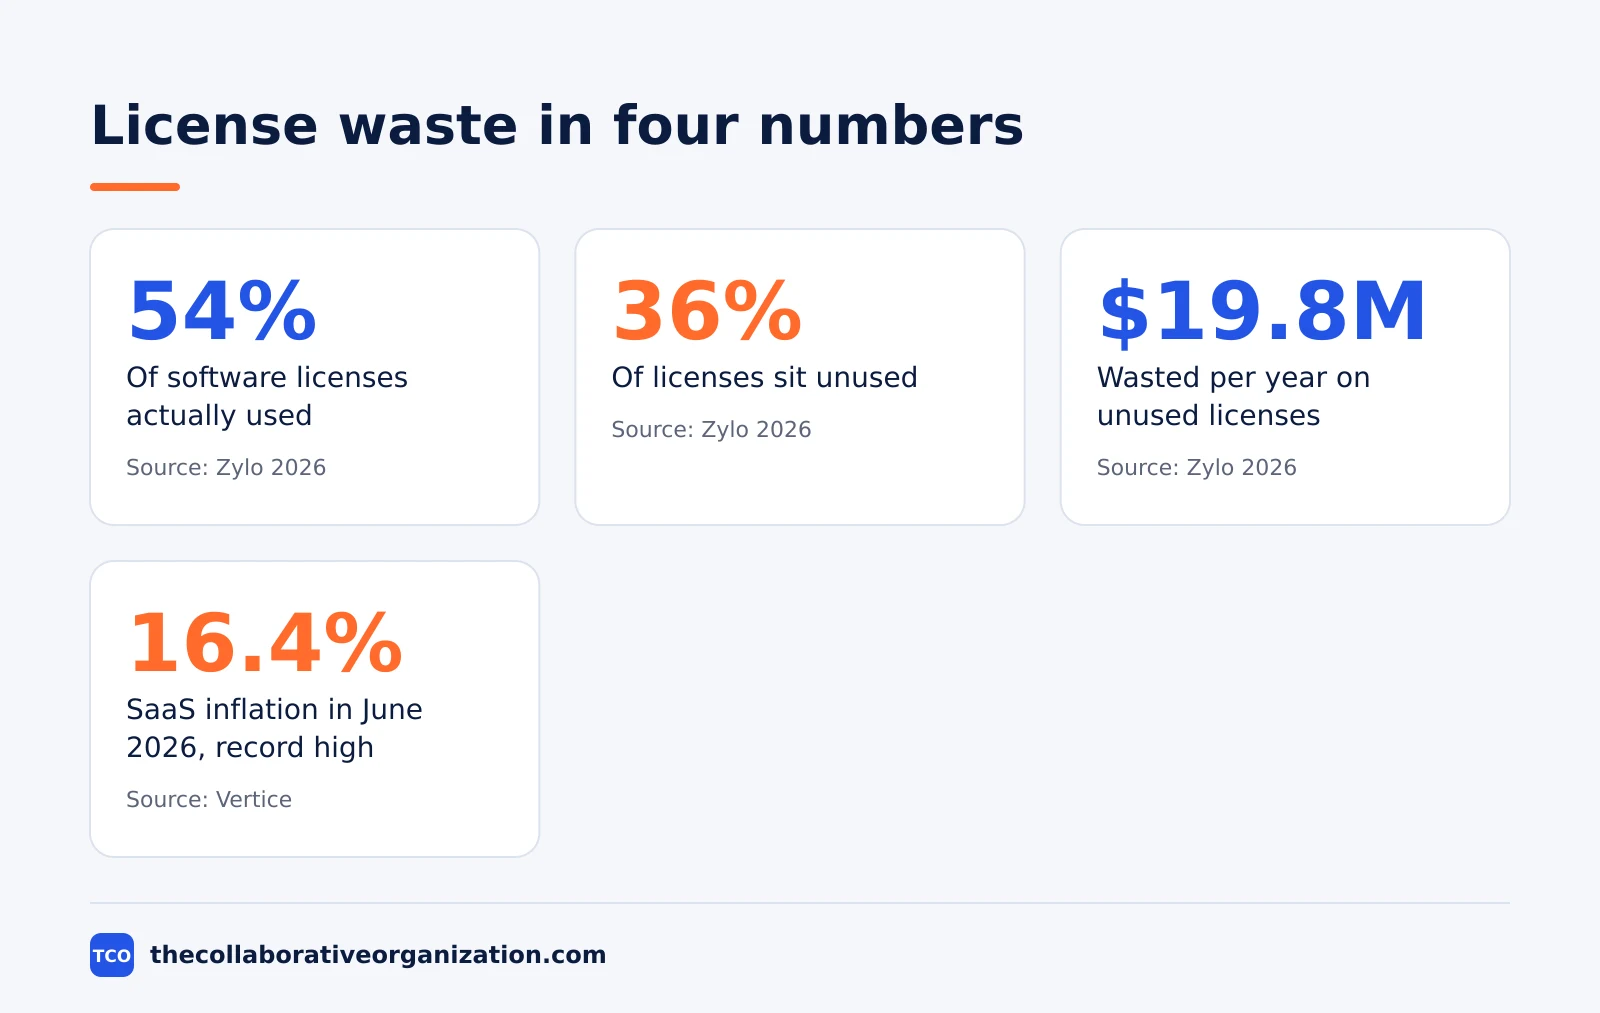
The waste sits beside the spend. Zylo finds companies use only 54% of the licenses they buy, with 36% unused against recommended levels, worth about $19.8 million a year for a typical large organization.
Flexera found that 35% of organizations report increased SaaS waste year over year. Waste is rising even as teams talk more about cutting it.
The 2025 edition put the waste at $21 million a year, up 14.2%, and showed the size gap: small companies run 152 apps for $11.5 million, while large enterprises run 660 apps for $284 million, according to Zylo.
Waste is a buying problem as much as a usage problem. Our guide on how to run a software trial shows how to test a tool before the contract locks in seats nobody uses.
Pricing, renewals and surprise charges
SaaS prices are rising far faster than general inflation, and renewals are where the rises land. Vertice puts SaaS inflation at 16.4% in June 2026, a record high, after 11.4% in January 2025, when general inflation in the G7 was about 2.7%.
The rises are broad, not limited to a few vendors. Vertice reports that over half of software vendors, 58%, put prices up over the past 6 months, and the index has never dropped below 10% a year in recent years.
Renewals carry most of the money. Zylo reports that the average organization faces 211 renewals a year, with 87% of total software spend tied up in them, yet 62% of IT leaders do not see renewals as a key chance to cut costs.
The bill also moves after signing. Zylo reports that in the last 12 months, 78% of IT leaders faced unexpected charges tied to consumption or AI pricing, and 61% had to cut projects because of unplanned software cost rises.
The cost of no visibility is quantified. Zylo quotes a Gartner prediction: organizations without central visibility into their SaaS portfolio will overspend by 25% through 2027.
Finance teams have noticed. BetterCloud reports that in 2026, 90% of FinOps teams manage SaaS spend, and 98% actively manage AI costs, up from 63% in 2025 and 31% in 2024.
Shadow IT and shadow AI in the numbers
Nearly half of the software in use sits outside IT approval, and AI tools are the fastest-growing part of it. BetterCloud finds only 56% of apps in use carry IT approval, and 21% of organizations discovered new unsanctioned SaaS and AI tools in 2026.
The direction is set. Gartner predicted in 2023 that by 2027, 75% of employees will acquire, modify or create technology outside IT’s visibility, up from 41% in 2022.
AI tools arrive through employees, not procurement. Microsoft and LinkedIn found in 2024, in a survey of 31,000 people in 31 countries, that 75% of knowledge workers use AI at work, and 78% of those users bring their own tools.
The expense report is the new buying channel. Zylo reports that expense-based SaaS spend rose 267% in a year, with ChatGPT now the most expensed application, and spend on AI-native apps rose 108% overall and 393% in organizations with more than 10,000 employees.
The cost is measured. IBM puts the global average breach cost at $4.44 million in 2025, with shadow AI a factor in 20% of breaches, adding $670,000 to average costs, and 97% of AI-related breaches lacked proper AI access controls.
Verizon sees the same pattern in breach data. In its 2026 DBIR, 45% of employees are regular AI users on corporate devices, up from 15%, and 67% reach AI through non-corporate accounts. Shadow AI is now the third most common non-malicious insider action in its data loss prevention data, up fourfold in a year.
The incidents are already happening. BetterCloud reports that in the past 12 months, 20% of organizations caught sensitive corporate data being shared publicly, 18% had a breach caused by an offboarded user who still had access, and 18% found data leaks from AI tools and chatbots.
The human side of these numbers matters too. Our guide to AI productivity statistics looks at what AI tools actually return for the time they take.
Adoption is not slowing. Our guide to AI in the workplace statistics tracks the same shift from the employee side.
SaaS statistics table: 40 numbers
How we chose these stats: every number below comes from the original publisher, opened on November 19, 2026, and each row names its source and year. Vendor studies describe that vendor’s own customers, so counts differ by sample; the table shows the range instead of picking one number. Forecasts are labeled as forecasts.
| Stat | Source | Year |
|---|---|---|
| $488.5 billion in worldwide SaaS revenue, forecast, up 21.9% | Statista | 2026 |
| $855.6 billion in worldwide SaaS revenue by 2031, 11.9% CAGR | Statista | 2026 |
| $299.1 billion in SaaS segment spending, up 19.2% | Gartner | 2025 |
| $723.4 billion in worldwide public cloud spending | Gartner | 2025 |
| $1.468 trillion in worldwide software spending, up 15.5% | Gartner | 2026 |
| $2.59 trillion in worldwide AI spending, up 47% (Gartner, via BetterCloud) | BetterCloud | 2026 |
| 305 SaaS apps per organization, average | Zylo | 2026 |
| 240 SaaS apps per organization, median | Zylo | 2026 |
| 118 SaaS apps per company, average | BetterCloud | 2026 |
| 8 SaaS apps per company in 2015 | BetterCloud | 2015 |
| 116 to 164 apps at mid-sized firms in one year, up 41% | BetterCloud | 2026 |
| 32 software tools per company, median | Cledara | 2026 |
| 144 SaaS apps per business, record level | Vertice | 2026 |
| 152 apps at companies with 1 to 500 employees | Zylo | 2025 |
| 660 apps at enterprises with 10,000 or more employees | Zylo | 2025 |
| 21 apps added per month at large enterprises | Zylo | 2026 |
| 1,000 or more cloud apps in use at most organizations | Nudge Security | 2026 |
| $55.7 million average annual SaaS spend per organization | Zylo | 2026 |
| $20.6 million median annual SaaS spend per organization | Zylo | 2026 |
| $4,830 SaaS spend per employee, up 21.9% | Zylo | 2025 |
| $9,455 median SaaS spend per employee | Zylo | 2026 |
| $8,000 software spend per employee at startups with up to 20 staff | Cledara | 2025 |
| $1,741 software spend per employee at firms with 100 to 200 staff | Cledara | 2025 |
| 54% of licenses used on average | Zylo | 2026 |
| 36% of licenses unused | Zylo | 2026 |
| $19.8 million wasted a year on unused licenses, typical large organization | Zylo | 2026 |
| $21 million wasted a year on unused licenses, average | Zylo | 2025 |
| 35% of organizations report increased SaaS waste year over year | Flexera | 2025 |
| 16.4% SaaS inflation in June 2026, record high | Vertice | 2026 |
| 211 renewals a year per organization, average | Zylo | 2026 |
| 56% of apps in use carry IT approval | BetterCloud | 2026 |
| 75% of employees will use tech outside IT visibility by 2027, up from 41% in 2022 | Gartner | 2023 |
| 78% of AI users bring their own tools to work | Microsoft and LinkedIn | 2024 |
| 267% rise in expense-based SaaS spend in one year | Zylo | 2026 |
| 108% rise in AI-native app spend in one year | Zylo | 2026 |
| $4.44 million global average cost of a data breach | IBM | 2025 |
| 20% of breaches involved shadow AI | IBM | 2025 |
| $670,000 added cost per breach with shadow AI | IBM | 2025 |
| 45% of employees are regular AI users on corporate devices, up from 15% | Verizon | 2026 |
| 98% of FinOps teams actively manage AI costs, up from 63% in 2025 (FinOps Foundation, via BetterCloud) | BetterCloud | 2026 |
What the numbers mean
The numbers point one way: software is getting bigger, dearer and harder to see. App counts are flat or rising again, spend per employee is near $9,000, and prices rise at double-digit rates while IT approval covers barely half the stack.
A 100-person company at the Zylo 2025 average of $4,830 per employee spends about $483,000 a year. If 36% of its licenses sit unused, about $174,000 of that bill pays for seats nobody opens. That is the size of the prize for a first audit. The figures are an illustration from published averages, not a promise.
The second lesson is that averages hide the spread. A median of 240 apps against an average of 305 shows a few very large portfolios pulling the mean up, so compare your own count with the median for your size, not the headline average.
The third lesson is to fix the buying channel before the count. Our guide to change management for new software covers how to roll out a smaller, approved stack without losing the teams that bought the extras.
Common SaaS statistics mistakes to avoid
Most SaaS statistics mistakes come from quoting a number without its population, its year or its definition. Run through the list before you cite any figure from this page.
- Quoting one app count as the truth. The range runs from 32 to 305, so name the source and the companies it measured.
- Mixing averages with medians. A median of 240 apps and an average of 305 describe the same data differently.
- Treating a forecast as a result. Gartner’s $299.1 billion for 2025 was a forecast, not a measured total.
- Using a vendor’s waste figure as a promise. Zylo’s $19.8 million describes its own large customers, not your company.
- Citing a roundup instead of the original. Trace each number to the study that published it, and check the year.
A number with its source, year and population is worth quoting. A number without them is just a rumor with digits.
Sources
- Zylo - 2026 SaaS Management Index (2026)
- Zylo - SaaS Subscription Management: A Guide for Buyers (2026)
- Zylo - 2025 SaaS Management Index (2025)
- BetterCloud - The 2026 State of SaaS Report (2026)
- BetterCloud - The big list of SaaS statistics that you should know (2026)
- Gartner - Gartner Forecasts Worldwide Public Cloud End-User Spending to Total $723 Billion in 2025 (2024)
- Statista - Cloud Computing - Worldwide (2026)
- Vertice - SaaS Inflation Index (2026)
- IBM - IBM Report: 13% of Organizations Reported Breaches of AI Models or Applications (2025)
- Microsoft and LinkedIn - Microsoft and LinkedIn release the 2024 Work Trend Index (2024)
Frequently asked questions
How many SaaS apps does the average company use?
It depends on who counts. BetterCloud puts the average at 118 apps in 2026, while Zylo puts it at about 305, because Zylo measures large enterprise portfolios under its management and BetterCloud surveys SaaS-first IT teams. Cledara puts the median small company at 32 tools. Quote the range with the source, not one number on its own.
How much does the average company spend on SaaS per year?
Zylo puts the average organization at $55.7 million a year in 2026, up 8% on the year, with a median of $20.6 million. The median is the better planning figure for most companies, because a few very large portfolios pull the average up. Per employee, the median is $9,455 a year.
What percentage of SaaS licenses are unused?
Zylo's 2026 data puts 36% of licenses unused against recommended utilization levels, and only 54% of licenses are used on average. For a typical large organization that waste is worth about $19.8 million a year. The 2025 edition put the waste at $21 million a year, so the rate moves with the sample each year.
How fast are SaaS prices rising?
Vertice puts SaaS inflation at 16.4% in June 2026, a record high, after 11.4% in January 2025. General inflation in the G7 was about 2.7% at that point, so software prices rose roughly four times faster than consumer prices. Over half of software vendors, 58%, put prices up over the past 6 months.
What share of SaaS apps is shadow IT?
BetterCloud finds that only 56% of apps in use carry IT approval, so 44% are not IT-sanctioned. Zylo puts shadow IT at a third of a company's applications. Gartner predicted in 2023 that by 2027, 75% of employees will acquire, modify or create technology outside IT visibility, up from 41% in 2022.
Related articles
guides
Free Project Management Templates: 7 to Copy (2026)
Seven free project management templates from monday, Wrike, Teamwork, Smartsheet, ClickUp, Asana and Trello, with what each one is for and what free really costs.
November 20, 2026 · 7 min read
guides
Project Proposal Template: Copy and Win Work (2026)
A project proposal template pitches the work before it is approved: problem, solution, scope, budget, timeline and terms. Copy the template and filled example.
November 20, 2026 · 10 min read
guides
Action Plan Template: Goal to Done in One Page (2026)
An action plan template turns one goal into owned steps with dates, dependencies and a success measure. Copy the table and see it filled for a support team.
November 20, 2026 · 11 min read