Software Adoption Statistics: 30 Numbers That Matter (2026) | The Collaborative Organization
By The Collaborative Organization Team · November 19, 2026 · Last verified November 19, 2026 · 11 min read
Software adoption is the gap between buying a tool and getting value from it. Nearly nine in ten organizations now use AI, yet they realize only about half of their software’s value, and a third of licenses go unused. The 30 statistics below come from the original studies, with the year and the source on every row.
Key takeaways
- Nearly 9 in 10 organizations use AI, but only 37% report any EBIT impact from it (McKinsey, 2026).
- Organizations realize only 52% of their software’s value, and 40% of tech spend underperforms on adoption (WalkMe, 2026).
- 53% of SaaS licenses go unused in an average month, wasting $21 million a year per organization (Zylo, 2025).
- Employees lose 7.9 hours a week to software friction, equal to 51 working days a year (WalkMe, 2026).
- Only 21% of workers believe their tools are adequate, against 88% of executives (WalkMe, 2026).
How we chose these stats
We kept only statistics we could trace to the study that published them, and we dropped every number we could not verify. Each row in the table links to its original source, with the publisher and the year beside it. Where the original is a vendor survey, the numbers describe that vendor’s customers, not every company, and we say so in the text.
We grouped the numbers into four themes: AI adoption, waste and sprawl, friction, and training. We favored recent data: most numbers come from 2025 and 2026 studies, and the two older ones are Pendo’s feature-adoption benchmarks from 2019, included because no newer original benchmark exists. One older number is flagged in the table so you can judge it yourself.
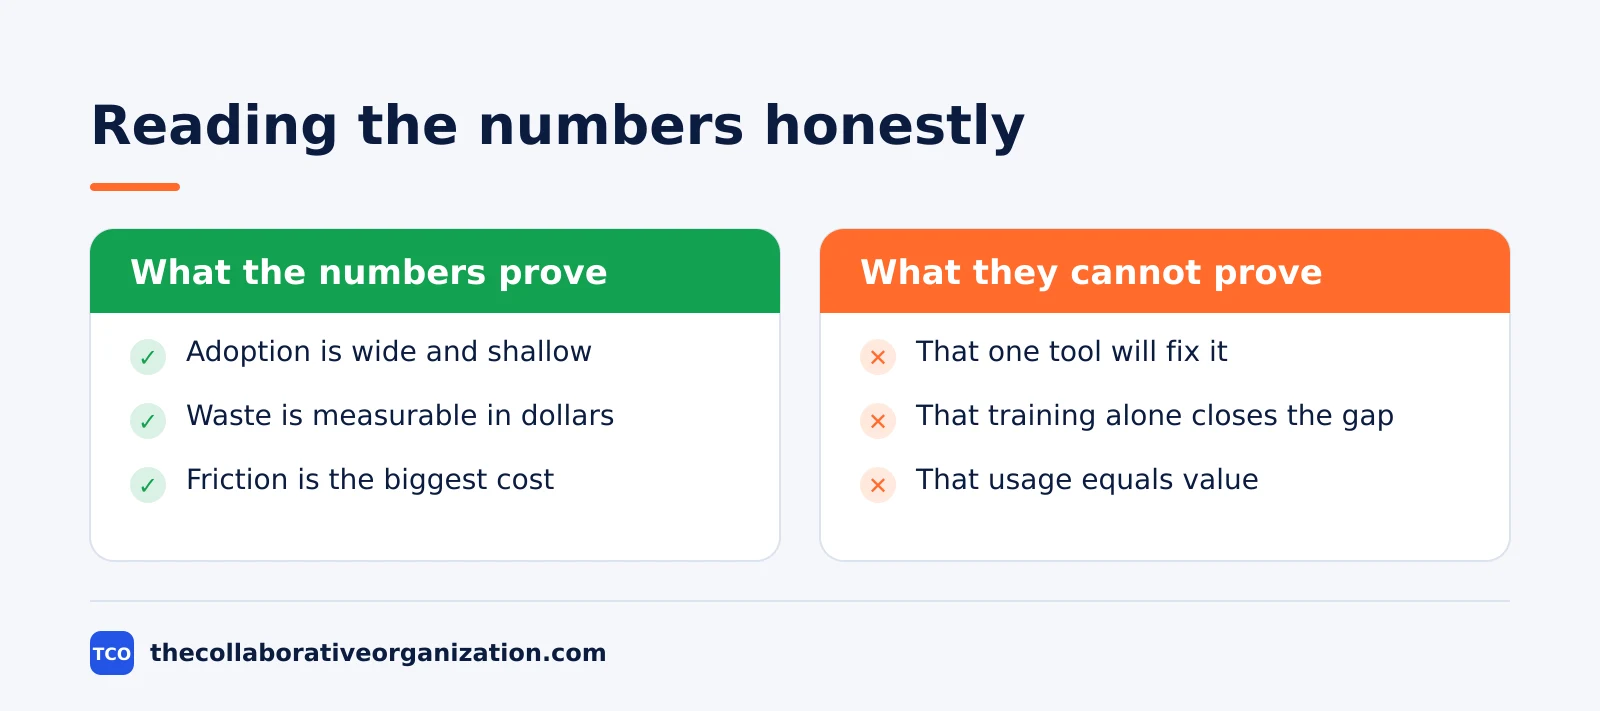
Vendor data needs a warning. McKinsey, Eurostat and Prosci run broad surveys, while WalkMe, Zylo, Freshworks and Pendo survey their own customers or users. Vendor numbers are still useful: they measure real usage across thousands of companies.
But they describe companies that already buy that kind of product, so treat them as a signal about the size of the problem, not as a census. Browse all our guides for the full set of adoption topics.
AI adoption: use is up, value is not
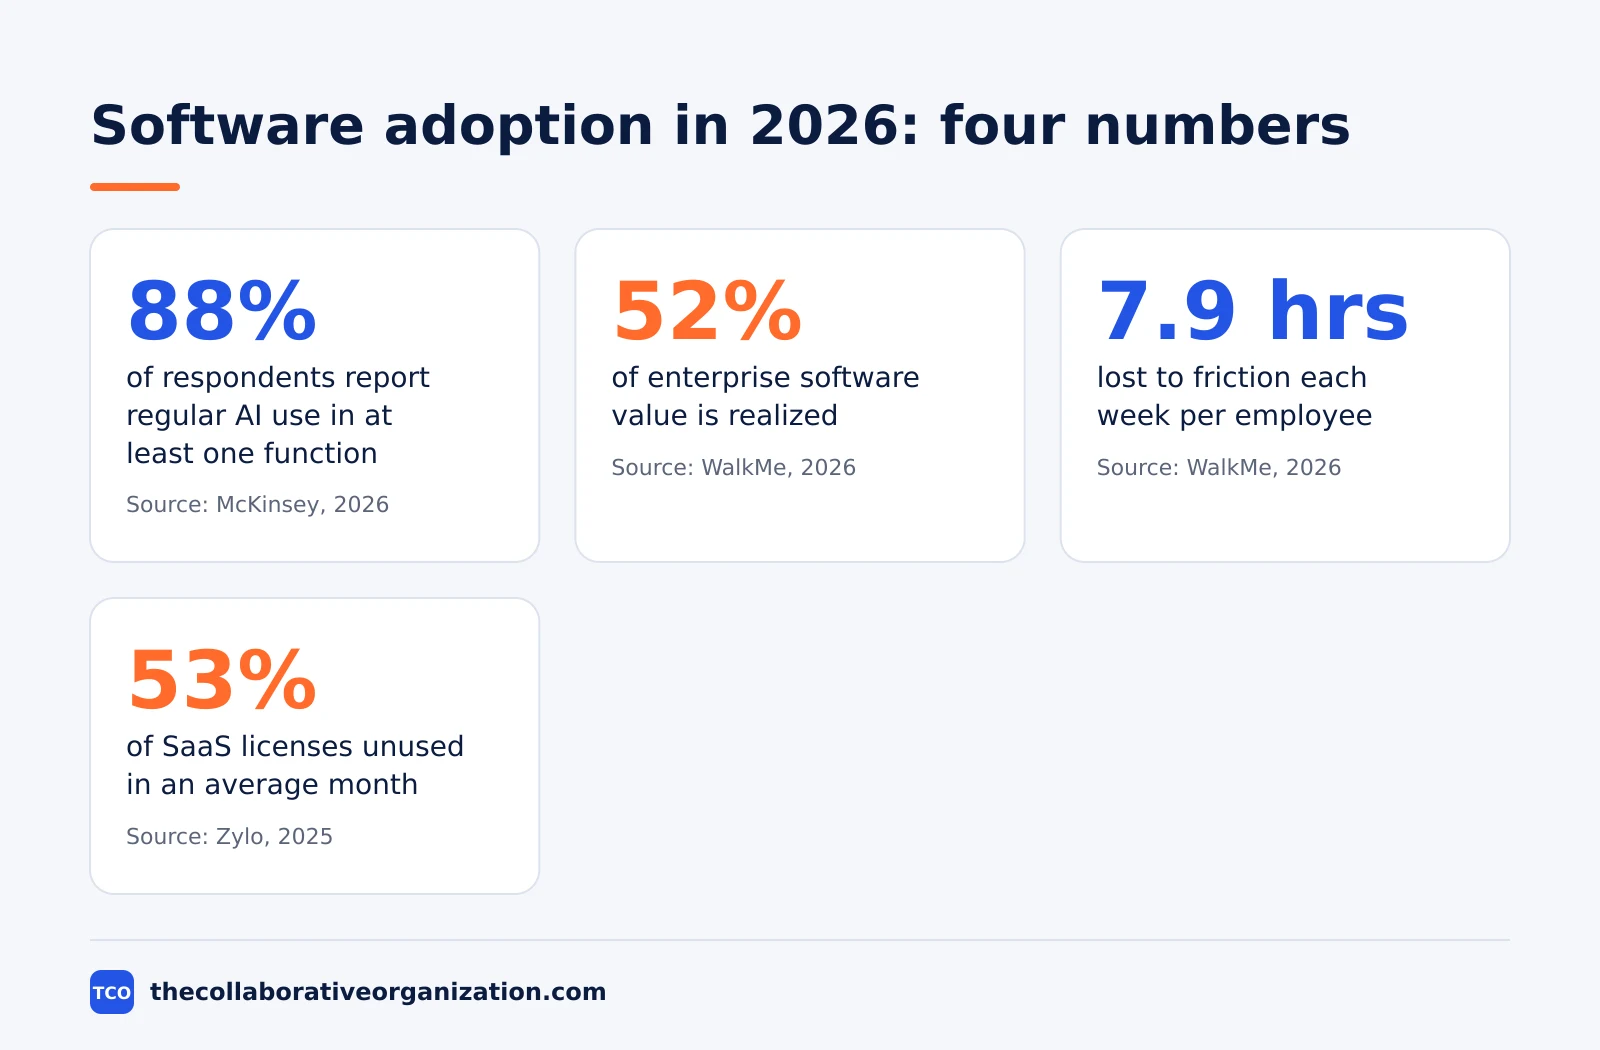
AI use is now nearly universal, but the financial payoff is still narrow. In McKinsey’s 2026 global survey, nearly nine in ten respondents report regular use of AI in at least one business function. The same survey finds 44% report AI scaling across the enterprise, up from 38% a year ago.
Depth is growing, but slowly. The share of respondents using AI in three or more functions rose from 51% to 56% in McKinsey’s 2026 survey, and 47% now report scaling chatbots across the enterprise. Large organizations lead: 54% of respondents from organizations with at least $1 billion in revenue report scaling AI, against one-third of smaller ones.
The money has not followed the usage. Only 37% of respondents in McKinsey’s 2026 survey attribute at least some EBIT impact to AI, about the same share as last year.
Just 6% are AI high performers who attribute at least 5% of EBIT to AI. Yet 80% say AI has improved their individual productivity, so the gains are real for people even when they are invisible in the accounts.
Europe tells the same story at a lower level. In 2025, 19.95% of EU enterprises with at least 10 employees used at least one AI technology, up from 13.48% in 2024, according to Eurostat.
The size gap is wide: 55.03% of large EU enterprises used AI, against 17.00% of small ones. Our guide to AI in the workplace statistics covers the wider AI picture in more depth.
Software adoption statistics: the full table
The table below holds all 30 statistics, grouped by theme, with the source and the year on every row. Every link goes to the original study, not to a list that repeats the number.
| Stat | Source | Year |
|---|---|---|
| Nearly 9 in 10 respondents report regular AI use in at least one business function | McKinsey | 2026 |
| 44% report AI scaling across the enterprise, up from 38% a year ago | McKinsey | 2026 |
| 56% use AI in three or more functions, up from 51% | McKinsey | 2026 |
| 54% of large organizations scale AI, vs one-third of smaller ones | McKinsey | 2026 |
| 40% of large organizations scale AI agents, up from 27% | McKinsey | 2026 |
| 47% scale chatbots across the enterprise | McKinsey | 2026 |
| 32% decided against buying software they could build with agentic coding tools | McKinsey | 2026 |
| 37% attribute at least some EBIT impact to AI | McKinsey | 2026 |
| 6% are AI high performers | McKinsey | 2026 |
| 80% say AI improved their individual productivity | McKinsey | 2026 |
| 19.95% of EU enterprises used AI in 2025, up from 13.48% in 2024 | Eurostat | 2025 |
| 55.03% of large EU enterprises used AI, vs 17.00% of small ones | Eurostat | 2025 |
| 275 SaaS applications per company on average in 2024 | Zylo | 2025 |
| 53% of SaaS licenses unused in an average 30-day period | Zylo | 2025 |
| $21 million wasted a year on unused licenses, on average | Zylo | 2025 |
| $4,830 average SaaS spend per employee per year | Zylo | 2025 |
| 247 SaaS renewals a year on average, one per business day | Zylo | 2025 |
| 7 new apps enter the environment each month on average | Zylo | 2025 |
| 84% of apps and 74% of spending sit outside IT | Zylo | 2025 |
| $1 of every $5 spent on software is wasted (20%) | Freshworks | 2025 |
| 6% of features generate 80% of clicks | Pendo | 2019 |
| Median feature adoption is 6.4%; the top 10% reach 15.6% | Pendo | 2019 |
| 7.9 hours a week lost to friction, equal to 51 working days a year | WalkMe | 2026 |
| 40% of technology spend underperforms due to adoption challenges | WalkMe | 2026 |
| Organizations realize only 52% of enterprise software value | WalkMe | 2026 |
| 29% of workers stop mid-task due to lack of guidance | WalkMe | 2026 |
| 53% switch between two to three apps to complete one task | WalkMe | 2026 |
| Leaders estimate 35 apps in use when 661 actually are | WalkMe | 2026 |
| Only 38% of workers feel well-trained on software and AI | WalkMe | 2026 |
| 21% of workers believe their tools are adequate, vs 88% of executives | WalkMe | 2026 |
Waste, sprawl and the friction tax
Companies buy more software than they use, and the unused part is the easiest money to find. In Zylo’s 2025 SaaS Management Index, the average company held 275 applications in its portfolio in 2024, and 7 new apps enter the environment each month on average. Left unmanaged, that pace means 33% portfolio growth a year.
The waste is measured in licenses, not just apps. In Zylo’s 2025 index, 53% of SaaS licenses go unused in an average 30-day period, and those unused licenses amount to $21 million in wasted spend a year on average. Average SaaS spend reached $4,830 per employee per year in the same index, so the waste grows with every hire.
The buying is also scattered. In Zylo’s 2025 index, 84% of applications and 74% of spending sit outside IT’s responsibility, and companies face 247 renewals a year on average, or one per business day.
Freshworks’ 2025 Cost of Complexity Report adds the same picture from the user side: companies waste $1 of every $5 on software, and 53% have not received the ROI they planned from it.
Friction is the second bill, paid in hours instead of dollars. In WalkMe’s 2026 research, employees lose 7.9 hours a week to friction, equal to 51 working days a year.
47% of that lost time comes from missing guidance rather than broken tools. More than half of workers, 53%, switch between two to three apps to complete a single task, and the average task spans 2.88 applications.
The value gap follows from those two bills. In WalkMe’s 2026 research, 40% of technology spend underperforms because of user adoption challenges, and organizations realize only 52% of broader enterprise software value. At the company level, WalkMe estimates $72 million a year in cost from time lost to friction and $142 million in total digital inefficiency per company per year.
Training gaps: leaders and workers see different tools
The training gap is the most fixable number in the table, and the most ignored. In WalkMe’s 2026 research, only 38% of workers say they feel well-trained on software and AI. The same research finds only 29% of workers say they receive sufficient training, against 91% of executives who believe they do.
The perception gap is wider than the training gap. In WalkMe’s 2026 research, only 21% of workers believe their tools are adequate, compared with 88% of executives, and only 9% of workers trust AI for high-impact work, while 55% trust it only for simple tasks. Leaders see a tool that works; workers see a tool that stalls.
Guidance inside the work closes part of the gap. In WalkMe’s 2026 research, workers with in-flow support are 3.7 times more confident that their training is relevant: 28% say training felt relevant with support, against 7% without it. That finding points at the fix: help inside the workflow beats another training session before it.
The morale cost shows up in the same data. In Freshworks’ 2025 survey, 60% of employees said they are at least somewhat likely to leave their organizations within the next year.
Complicated processes and poor software were among the drivers. In the same survey, 17% said someone on their team quit or burned out because of an implementation in the past year.
What the numbers mean for your team
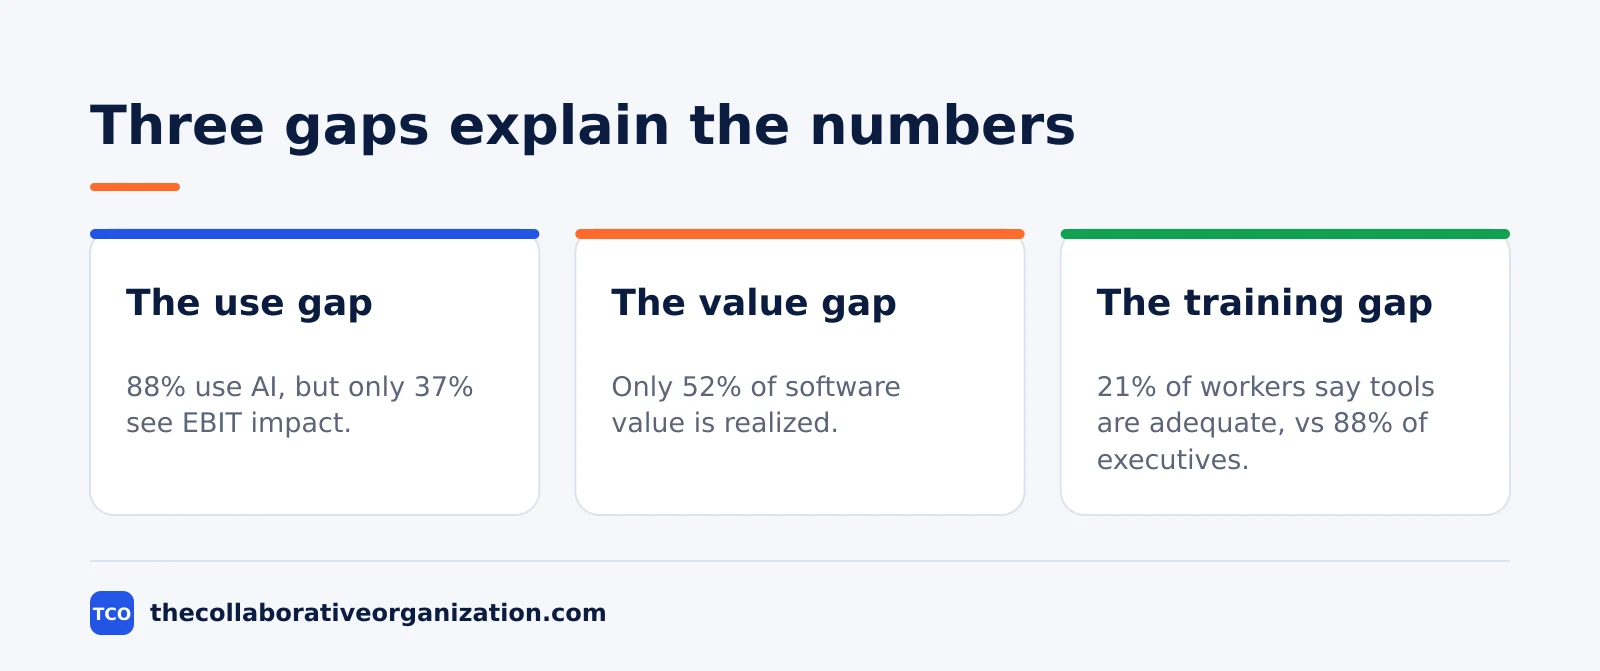
The numbers point to one conclusion: adoption is a workflow problem, not a buying problem. Buying more tools adds to the 275-app pile, while fixing the workflows inside the tools you already own recovers the 48% of value that WalkMe’s 2026 research says goes unrealized.
Start with the three gaps in order. First, the use gap: nearly nine in ten organizations use AI, but only 37% see EBIT impact, so ask which workflows the tools actually improved.
Second, the value gap: 52% of software value realized means the business case was written for a tool nobody fully uses.
Third, the training gap: 21% of workers against 88% of executives on tool adequacy means the plan was written by people who do not do the work.
The change research backs the same order. Prosci’s correlation data shows that initiatives with excellent change management are six times more likely to meet objectives than those with poor change management, as reported in the WalkMe guide to Prosci. For the productivity side of the same story, see AI productivity statistics.
Track adoption where the work happens. In Asana, the adoption numbers live next to the tasks: completion rates, owners and due dates in one place, so a stalled workflow is visible the day it stalls.
The same numbers belong on a board the whole team can see. In monday.com, usage, training completion and ticket trends can sit on one dashboard, so the rollout review starts from evidence instead of opinions.
If the numbers point to a switch, our guide on how to choose project management software covers the selection step.
Worked example: a 100-person company reads the numbers
Imagine a 100-person company spending $4,830 per employee a year on software, and picture what the table says about it. This example is an illustration, not a case study, and the numbers are made up to show the method.
The bill is $483,000 a year for software. At Zylo’s 2025 rate of 53% of licenses unused, about $256,000 of that buys seats nobody opens. At WalkMe’s 2026 rate of 52% of value realized, the company gets about $251,000 of value from its $483,000 spend, so nearly half the budget buys nothing the team can feel.
The hours tell the same story. At 7.9 hours a week lost to friction per employee, the company loses 790 hours a week, or about 20 full-time roles spent fighting tools instead of doing work. At 29% of workers stopping mid-task for lack of guidance, roughly 29 people stall every day on something a short in-app guide could have answered.
The fix follows the gaps. The company cancels the unused licenses first, then picks its three most-used workflows and adds guidance inside them, then retrains by role instead of by feature list. Three months later it re-measures: licenses used, tasks completed without help, and tickets per week. The numbers, not the launch date, decide whether the change worked.
Common software adoption mistakes to avoid
The table warns against five mistakes, and every one of them is a decision, not an accident. Check them before the next renewal round.
- Buying before measuring. A new tool joins a 275-app pile when nobody measured what the old one actually did.
- Counting logins instead of work. A login says someone opened the tool; completion rates and workflow speed say whether the work got done.
- Training once, on launch day. Only 38% of workers feel well-trained, and one session does not change that number.
- Ignoring the license count. At 53% unused, the renewal round is the cheapest place to find money.
- Letting leaders grade their own rollout. When 21% of workers and 88% of executives disagree about the tools, the workers are the ones doing the work.
Sources
- McKinsey - The State of AI: Global Survey 2026 (2026)
- WalkMe - Software Adoption ROI: Improve Returns (2026)
- WalkMe - What Is Prosci Change Management? ADKAR Model Explained (2026)
- Zylo - IT Strategy: 5 Stats That Prove You Need SaaS Management (2025)
- Freshworks - 20% of Software Budgets Wasted on Unnecessary Business Complexity (2025)
- Pendo - Why Feature Adoption May Be Your Biggest Weakness or Strength (2019)
- Eurostat - Digital Economy and Society Statistics: Enterprises (2025)
Frequently asked questions
What is the software adoption rate in 2026?
It depends on what you count. Nearly nine in ten organizations report regular AI use in at least one business function, according to McKinsey's 2026 survey, but only 44% report AI scaling across the enterprise. For everyday software, WalkMe's 2026 research finds organizations realize only 52% of enterprise software value.
How much software goes unused?
A lot. Zylo's 2025 SaaS Management Index finds 53% of SaaS licenses go unused in an average 30-day period, wasting $21 million a year on average per organization. Pendo's benchmarking finds 6% of product features generate 80% of clicks, which means almost 94% of features are rarely touched.
How much time do employees lose to bad software?
WalkMe's 2026 research puts it at 7.9 hours a week per employee, equal to 51 working days a year, mostly from missing guidance and switching between apps. Freshworks' 2025 survey finds a similar figure: nearly seven hours a week lost to complicated processes and fragmented tools.
Why do employees resist new software?
The numbers point to training and trust, not stubbornness. WalkMe's 2026 research finds only 38% of workers feel well-trained on software and AI, and only 21% believe their tools are adequate, against 88% of executives. When leaders and workers see different tools, resistance is a signal, not a character flaw.
Do these statistics come from the original studies?
Yes. Every number in the table links to the study that published it, with the year and the publisher on each row. Vendor surveys are included because they run the largest samples, but they are labeled as vendor data where that matters, and no number comes from a list that cites no source.
Related articles
guides
Free Project Management Templates: 7 to Copy (2026)
Seven free project management templates from monday, Wrike, Teamwork, Smartsheet, ClickUp, Asana and Trello, with what each one is for and what free really costs.
November 20, 2026 · 7 min read
guides
Project Proposal Template: Copy and Win Work (2026)
A project proposal template pitches the work before it is approved: problem, solution, scope, budget, timeline and terms. Copy the template and filled example.
November 20, 2026 · 10 min read
guides
Action Plan Template: Goal to Done in One Page (2026)
An action plan template turns one goal into owned steps with dates, dependencies and a success measure. Copy the table and see it filled for a support team.
November 20, 2026 · 11 min read