PERT vs Gantt Chart: Differences, Uses and Examples (2026) | The Collaborative Organization
By The Collaborative Organization Team · November 19, 2026 · Last verified November 19, 2026 · 9 min read
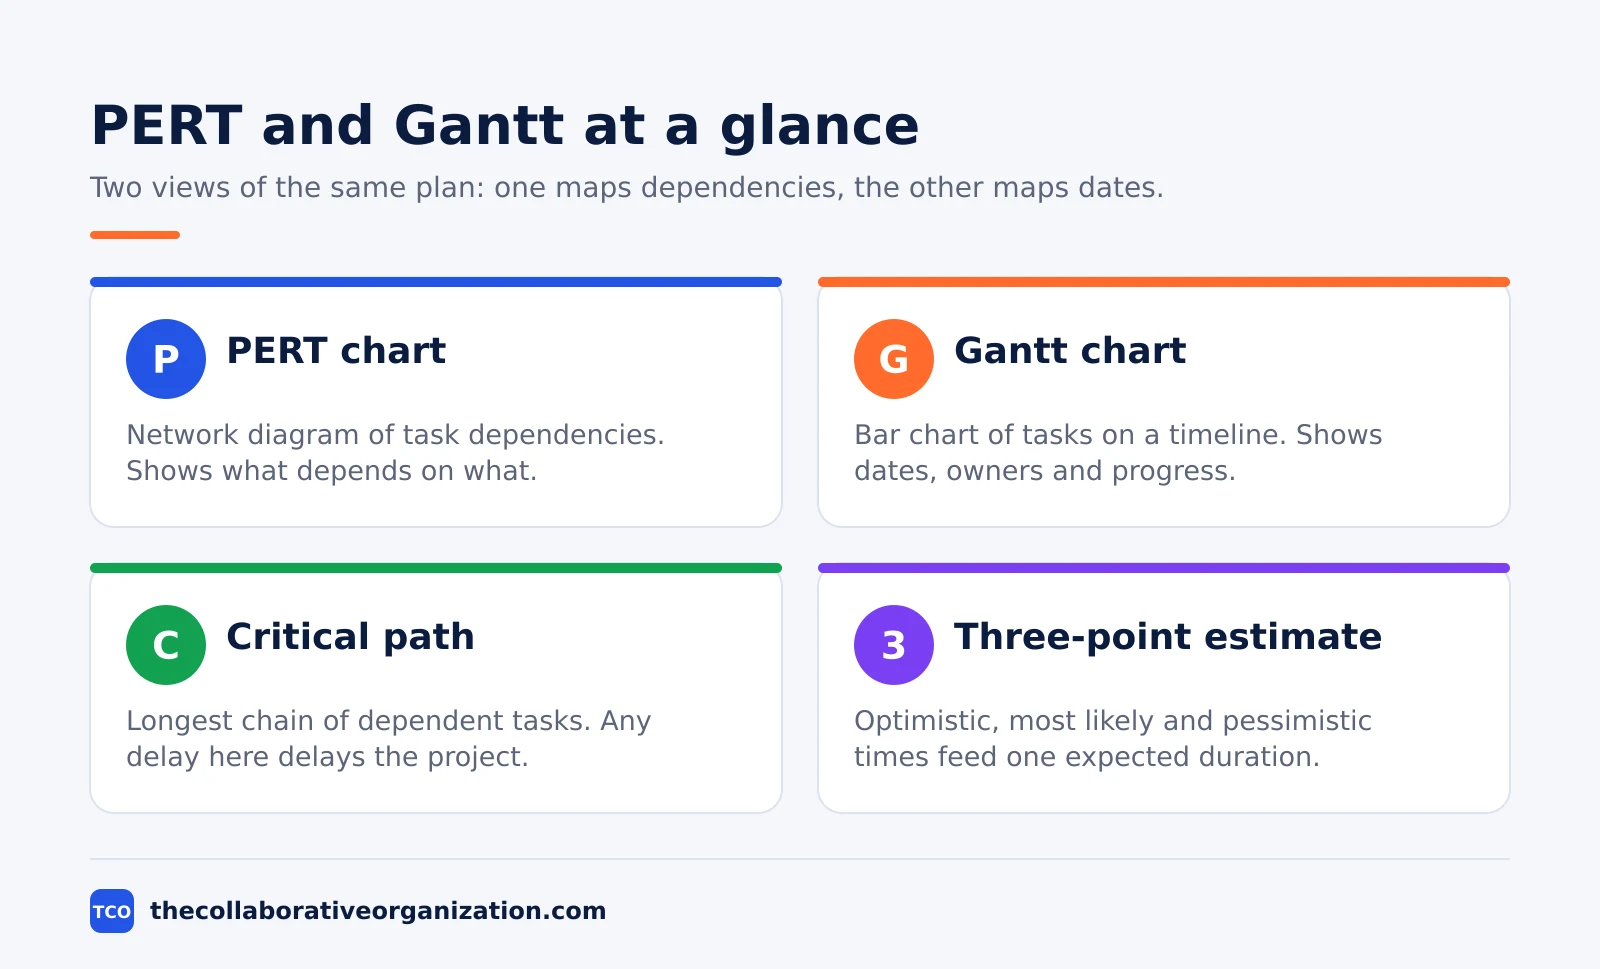
A PERT chart maps task dependencies in a network diagram, while a Gantt chart shows the same tasks as bars on a calendar timeline. PERT answers what depends on what and how long the whole project should take, and Gantt answers who does what, on which day, and what is late.
Key takeaways
- A PERT chart is a network of task boxes joined by arrows, and a Gantt chart is a bar chart with time on the horizontal axis.
- PERT fits the planning phase, when durations are uncertain, and Gantt fits the execution phase, when dates and owners are set.
- The PERT formula turns three estimates into one expected duration: expected time equals (optimistic + 4 x most likely + pessimistic) / 6.
- The critical path is the longest chain of dependent tasks, and any delay on it delays the whole project.
- Most teams should use both charts: PERT first to plan, then Gantt to track.
What is a PERT chart?
A PERT chart is a network diagram that shows project tasks as boxes joined by arrows, where each arrow marks a dependency between two tasks. PERT stands for Program Evaluation and Review Technique, and the chart has no time axis. You read it by following the arrows from the first task to the last.
The chart was developed by the U.S. Navy in the 1950s to manage complex projects, and Smartsheet notes it was built for the Polaris missile program era, when no one had scheduled that kind of work before. Each box can hold the task name, its expected duration, and its completion percentage.
PERT shines when durations are uncertain. Instead of one guessed number per task, the team gives three: optimistic, most likely, and pessimistic. Those three numbers feed the PERT formula, which weights the most likely case four times more than either extreme.
What is a Gantt chart?
A Gantt chart is a horizontal bar chart where each row is a task and the bar length shows its duration on a calendar axis. Henry Gantt created it in the early 1900s so a manager could see a project status at a glance. The horizontal axis shows time, and the vertical axis lists the tasks.
Each bar shows when a task starts, when it ends, and how far along it is, because the filled part of the bar marks completion. Modern Gantt charts also draw lines between dependent tasks, though the original form did not show dependencies at all.
Gantt charts suit tracking and communication. A manager can see which tasks are late, which owner is loaded, and which milestone comes next, all in one view. Smartsheet calls the Gantt chart the better tool for monitoring project status, and notes it is usually easier to read than a PERT network.
PERT vs Gantt chart: side by side
The core difference is focus: PERT is dependency-first, and Gantt is timeline-first. One shows the logic of the work, and the other shows the schedule of the work.
| Feature | PERT chart | Gantt chart |
|---|---|---|
| Shape | Network diagram with boxes and arrows | Bar chart with rows and bars |
| Main question | What depends on what? | Who does what, and when? |
| Time axis | None; order comes from arrows | Horizontal axis is the calendar |
| Best phase | Planning, before dates are fixed | Execution, while work runs |
| Critical path | Easy to find and trace | Hard to see without the network |
| Progress view | Completion percentage inside each box | Filled part of each bar |
| Reading style | Read as a whole to trace paths | Read left to right to track dates |
The two charts agree on the basics: both list the tasks, both show dependencies, and both can carry owners and durations. ProofHub puts it plainly: PERT focuses on dependencies and time estimates, while Gantt gives a visual timeline of start dates, end dates, and progress.
The PERT formula and the critical path
The PERT formula turns three time estimates into one expected duration, and the critical path is the longest chain of dependent tasks in the network. Together they turn a rough plan into a date the team can defend.
The formula is expected time = (O + 4M + P) / 6, where O is optimistic, M is most likely, and P is pessimistic. The divisor is 6 because the weights add to 6. The spread also gives a standard deviation of (P - O) / 6, which shows how much trust to put in the number.
The critical path is the longest sequence of tasks in the plan, and it sets the shortest possible finish date. A delay on any task on this path pushes the whole project back by the same amount, while tasks off the path have slack. Smartsheet notes most projects have one critical path, though some have more than one.
Worked example: a PERT estimate and critical path
Imagine a team of four people building a small online course in six weeks, with one uncertain task: record the video lessons. The team estimates 4 days if everything goes right, 7 days in the normal case, and 13 days if the presenter is ill and the studio is booked out.
Apply the formula: (4 + 4 x 7 + 13) / 6 = (4 + 28 + 13) / 6 = 45 / 6 = 7.5 days. The standard deviation is (13 - 4) / 6 = 1.5 days, so the team plans for 7.5 days and knows the range is wide. A single guess of 7 days would have hidden that risk.
Now map the chain: write the script (3 days), record the lessons (7.5 days), edit the video (5 days), then publish (1 day). That chain totals 16.5 days, while a side chain of slides (4 days) and quiz questions (3 days) totals 7 days. The video chain is the critical path, so the team protects recording time first.
When to choose each chart
Choose PERT when uncertainty and dependencies decide the date, and choose Gantt when dates, owners, and progress need a clear view. Many teams use PERT first, then Gantt, on the same project.
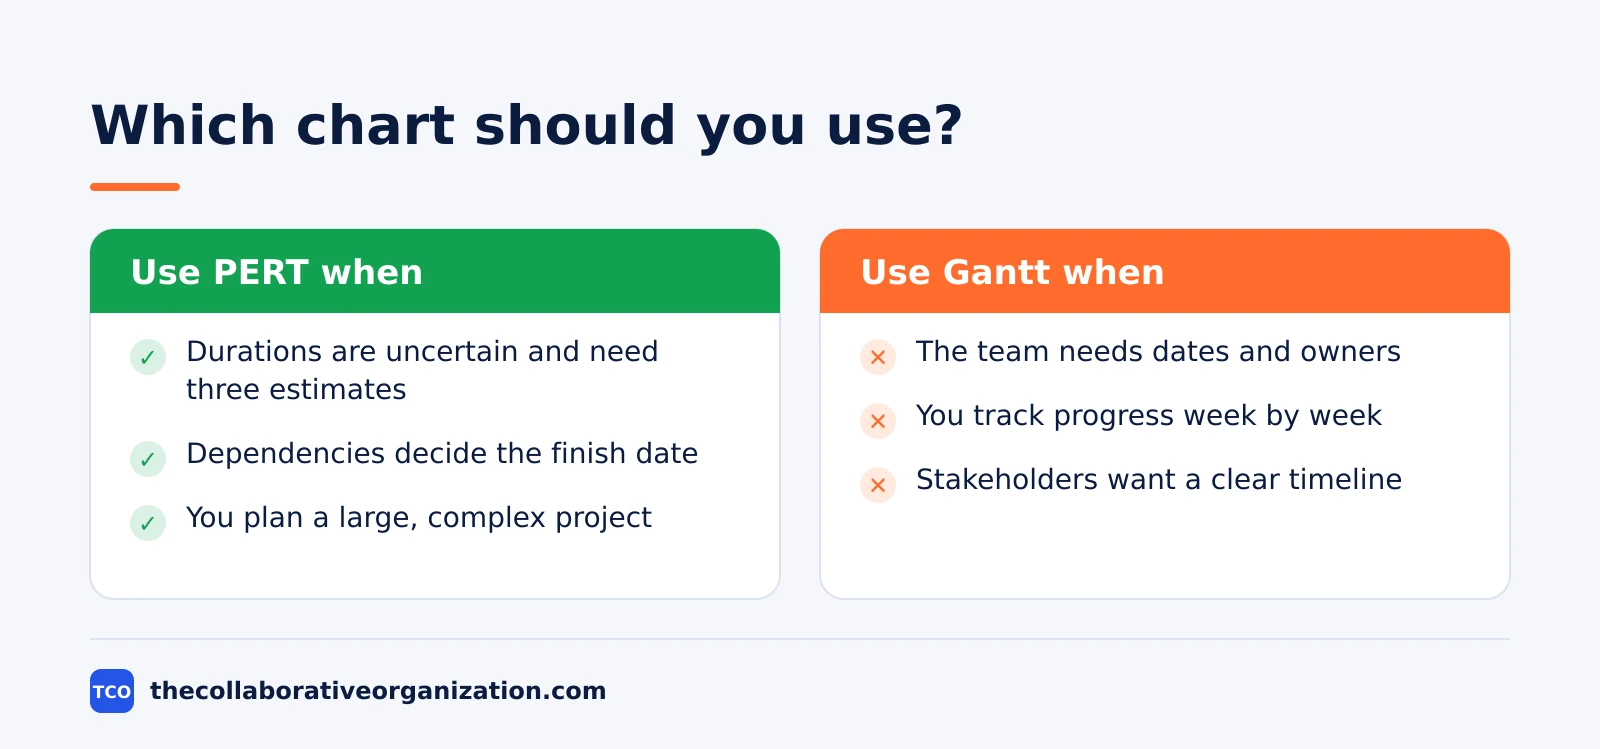
Use a PERT chart when you need to anticipate how long the project will take, find the critical path, plan a large or complex project, or show how tasks depend on each other. It also helps when the team must discuss risk, because the three estimates force an honest talk about best and worst cases.
Use a Gantt chart when you need to show how long each task takes, assign clear owners, or report progress to people outside the team. Lark notes the split well: PERT is strongest in planning, and Gantt is strongest in execution, when the question is what is late and which milestone is next.
Tools that draw PERT and Gantt charts
Most project tools draw Gantt charts well, and fewer draw PERT networks, so check the view list before you pick one. The three tools below all offer Gantt views, and our guide to how to choose project management software covers seat counts and free-plan caps.
| Tool | Best for | Free plan | Starting price (as of November 2026) | Notable limit |
|---|---|---|---|---|
| Asana | Timeline and Gantt views with dependencies | Free for 2 people | $10.99 per user per month, billed annually | Gantt views start on the paid Starter plan |
| monday.com | Visual boards with a timeline view | Free plan for up to 2 seats | $9 per seat per month (Basic), billed annually | Gantt view starts on Standard at $12 |
| ClickUp | Gantt charts plus goals and docs in one place | Free Forever plan | $9 per user per month (Core), billed annually | Yearly billing needed for that price |
The Asana price comes from Asana pricing, where Starter is $10.99 per user per month billed annually. On the monday.com pricing page, Basic is $9 per seat per month billed annually with a 3-seat minimum. The ClickUp pricing page lists Core at $9 per user per month billed yearly, shown against a $12 regular price.
If you need a true PERT network view, check the tool first: many tools call a dependency view a network diagram, but few compute the critical path from three-point estimates. A spreadsheet can hold the PERT math while the tool holds the Gantt view.
How to build a PERT chart in 4 steps
Building a PERT chart takes four moves: list the work, estimate three times, draw the network, then find the critical path. The first two steps use no chart at all.
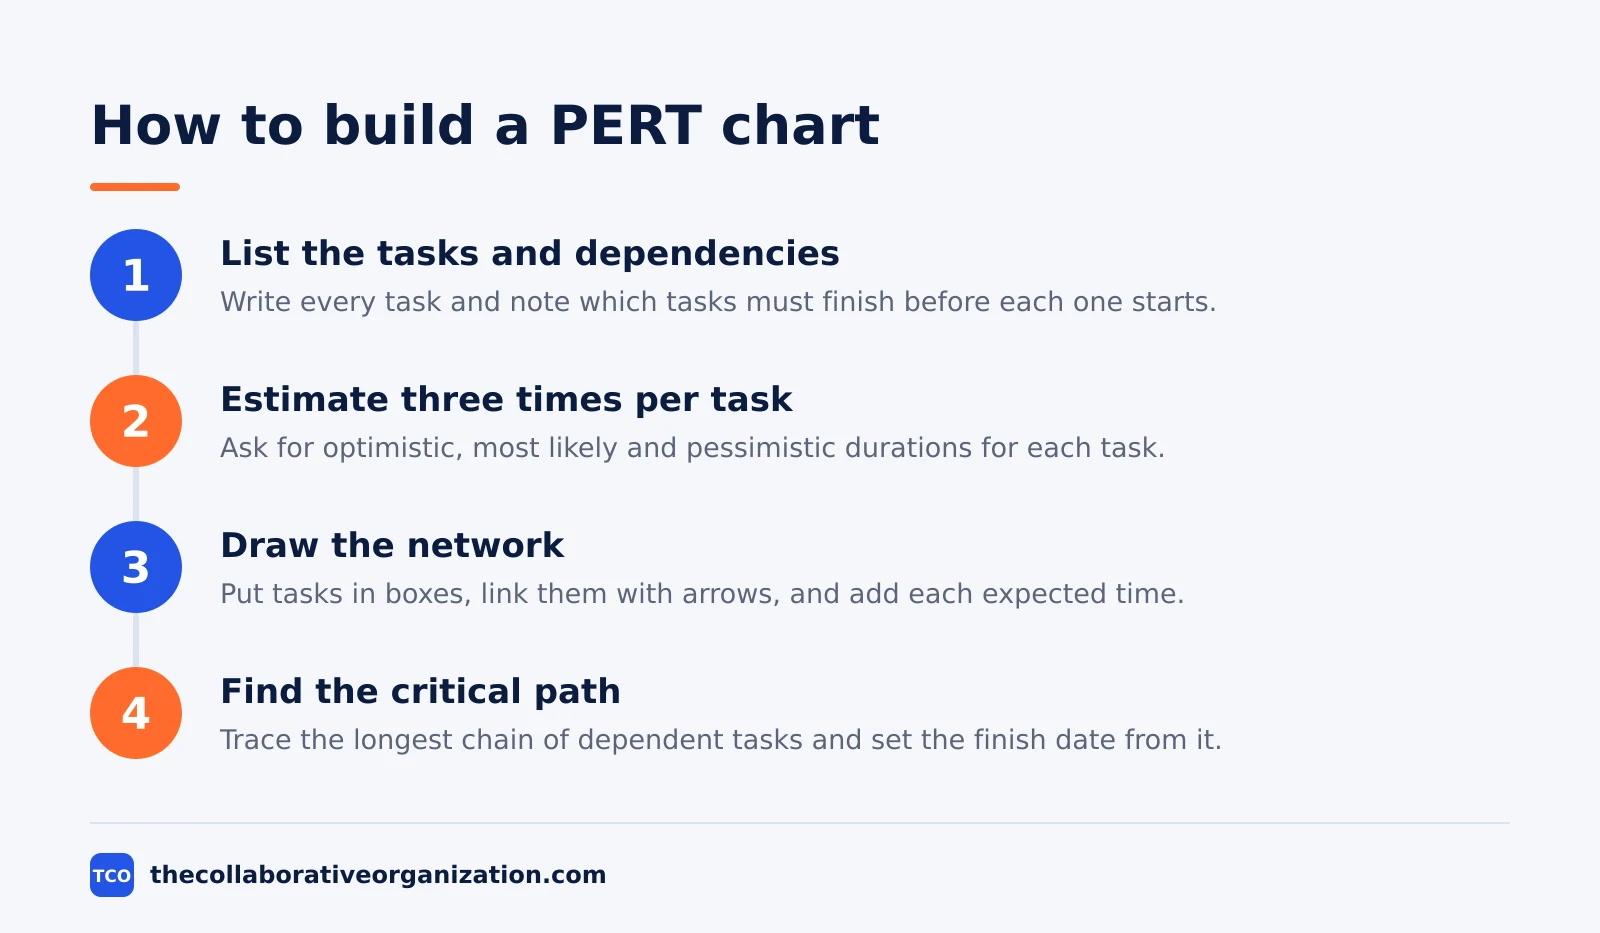
First, list every task and note which tasks must finish before each one starts. Second, ask the person doing each task for optimistic, most likely, and pessimistic durations, then compute the expected time.
Third, draw the boxes and arrows in dependency order and write each expected time in its box. Fourth, trace every path through the network, find the longest one, and set the finish date from it.
Compare the result with the Gantt view of the same work, and with other ways to track progress:
- The kanban vs Gantt chart guide shows how a timeline view differs from a flow view.
- The burndown chart guide shows another way to track remaining work.
- The burndown vs burnup chart comparison helps you pick the progress view that fits your reporting style.
Common PERT vs Gantt chart mistakes to avoid
Most teams go wrong in the same five ways, and all five come from using one chart for a job the other does better. Run through the list before you share the plan.
- Using a Gantt chart to find the critical path. The timeline hides which chain of tasks decides the date, so build the network first.
- Using one estimate per task in PERT. A single number hides risk; the three estimates are the whole point of the method.
- Treating the PERT date as a promise. The expected time is a weighted average with a spread, not a guarantee, so share the range too.
- Drawing dependencies on the Gantt chart only. A bar chart with lines is still hard to read as a network, and missed links hide delays.
- Never updating the Gantt chart. A timeline that still shows last month’s dates misleads the team, so update it at each weekly review.
Sources
- Smartsheet - PERT Charts vs. Gantt Charts (2024)
- ProofHub - PERT Chart vs Gantt Chart (2026)
- Lark - Gantt and PERT Charts Explained (2026)
- OnPlana - PERT Estimation Formula Explained, With a Worked Example (2026)
- Re:Work - Three-Point Estimation (PERT): Formula and Examples (2026)
- Re:Work - PERT Chart: Definition, How to Make One, and Examples (2026)
- Asana - Pricing (2026)
- monday.com - Pricing (2026)
- ClickUp - Pricing (2026)
Frequently asked questions
What is the main difference between a PERT chart and a Gantt chart?
A PERT chart is a network diagram that shows which tasks depend on which, and it finds the critical path through the project. A Gantt chart is a bar chart that shows each task on a calendar timeline, with start dates, end dates and owners. Use PERT to plan an uncertain schedule and Gantt to track the work once dates are set.
Can you use a PERT chart and a Gantt chart together?
Yes, and most teams should. Build the PERT chart first to map dependencies, estimate durations with three-point estimates, and find the critical path. Then turn that plan into a Gantt chart to assign dates and owners and track progress week by week. The two charts show the same plan from two angles.
What is the PERT formula?
The PERT formula turns three estimates into one expected duration: expected time equals optimistic plus four times most likely plus pessimistic, divided by six. The most likely estimate carries four times the weight of either extreme. The spread also gives a standard deviation, which is pessimistic minus optimistic divided by six.
What is the critical path in a PERT chart?
The critical path is the longest chain of dependent tasks in the project, and it sets the shortest possible finish date. Any delay on a task on this path delays the whole project by the same amount. Tasks off the path have slack, which means they can slip a little without moving the finish date.
Which chart is better for a small project?
A Gantt chart is usually better for a small project, because it is easy to read and shows dates and owners at a glance. A PERT chart adds real value when durations are uncertain, tasks depend on each other in complex ways, or the team needs to know which chain of tasks decides the finish date.
Related articles
guides
Free Project Management Templates: 7 to Copy (2026)
Seven free project management templates from monday, Wrike, Teamwork, Smartsheet, ClickUp, Asana and Trello, with what each one is for and what free really costs.
November 20, 2026 · 7 min read
guides
Project Proposal Template: Copy and Win Work (2026)
A project proposal template pitches the work before it is approved: problem, solution, scope, budget, timeline and terms. Copy the template and filled example.
November 20, 2026 · 10 min read
guides
Action Plan Template: Goal to Done in One Page (2026)
An action plan template turns one goal into owned steps with dates, dependencies and a success measure. Copy the table and see it filled for a support team.
November 20, 2026 · 11 min read