Kanban vs Gantt Chart: Which Fits Your Work? (2026) | The Collaborative Organization
By The Collaborative Organization Team · November 19, 2026 · Last verified November 19, 2026 · 11 min read
Kanban tracks work as it flows through stages, while a Gantt chart plans tasks on a timeline. The difference is the question each view answers. Kanban asks “what is happening now, and where is it stuck?” A Gantt chart asks “when does each piece happen, and what blocks the rest?” Pick the view that matches your question.
Key takeaways
- Kanban is flow-based: cards move through stages, and WIP limits cap how much work is in progress.
- A Gantt chart is timeline-based: bars show start dates, end dates, dependencies and milestones.
- Use Kanban for ongoing work with rolling arrivals, and Gantt for a project with a fixed deadline and a set sequence.
- Henry Gantt popularized his chart around 1910 to 1915, while Kanban took shape at Toyota in the 1950s.
- Most teams use both views on the same tasks: Gantt to plan, Kanban to run the day.
The core difference in one sentence
Kanban shows the state of the work, and a Gantt chart shows the timing of the work. A board tells you that five cards sit in review and none has moved for three days. A Gantt chart tells you that testing starts on Monday and cannot start until the build ends on Friday. Both facts matter, but they answer different questions.
Lark draws the same line: Gantt charts are timeline-based and Kanban boards are flow-based. The Gantt chart asks when the project will finish. The Kanban board asks what the current status of the work is. A team that mixes the two questions up picks the wrong view and then blames the tool.
A quick test settles it. Ask the team what they need to know this week. If the answer is “what should we work on next, and what is blocked?”, they need a board. If the answer is “will we hit the launch date, and what slips if design is late?”, they need a timeline.
What a Kanban board shows
A Kanban board shows cards moving through columns, with a limit on how many cards can sit in one column at a time. Each card is one task, and each column is one stage, such as To Do, In Progress, Review and Done. A team member drags a card to the next column when the work moves on.
The board comes from Toyota in the 1950s, where Taiichi Ohno built a pull system: a later step pulled work from an earlier step when it needed it. Rework dates it to Toyota in the 1950s, with full use across Toyota plants by 1963. David J. Anderson later applied the same ideas to software teams between 2004 and 2007.
The limit is the part most teams skip, and it is the part that makes the board work. A “WIP limit” caps the cards in a column, so the team finishes work before starting more. Our guide to WIP limits in Kanban shows how a limit of 3 exposes a bottleneck that a limit of 10 hides.
A board also shows flow at a glance. When ten cards pile up in review, the team sees the jam without a meeting or a report. The fix is to help the review step, not to start more work. That is why boards suit support queues, content pipelines and any work that arrives on a rolling basis.
What a Gantt chart shows
A Gantt chart shows tasks as horizontal bars on a calendar, with arrows linking tasks that depend on each other. Each bar starts on the planned start date and ends on the planned finish date. A diamond marks a milestone, such as a launch or a sign-off, and a line shows today.
The chart is named after Henry Gantt, an American engineer who popularized it around 1910 to 1915. Wikipedia notes that a similar tool came first: Karol Adamiecki built the harmonogram in 1896, but he published in Polish and Russian, so the English-speaking world credits Gantt. The chart proved its worth in the First World War, tracking munitions production.
Dependencies are the reason the chart still matters. When task B cannot start until task A ends, the chart draws that link, and a delay in A moves B. The chain of linked tasks that sets the earliest finish date is the “critical path”, and it is the first thing a project lead checks when a date slips.
A Gantt chart also shows the whole project in one picture, which is why managers use it for stakeholder updates. One page shows the phases, the milestones, the owners and the finish date. The cost is upkeep: the chart only stays true when one person updates it as dates change.
Kanban vs Gantt chart side by side
Side by side, Kanban wins on flow and flexibility, while Gantt wins on dates and dependencies. The table below compares the six things that decide most choices.
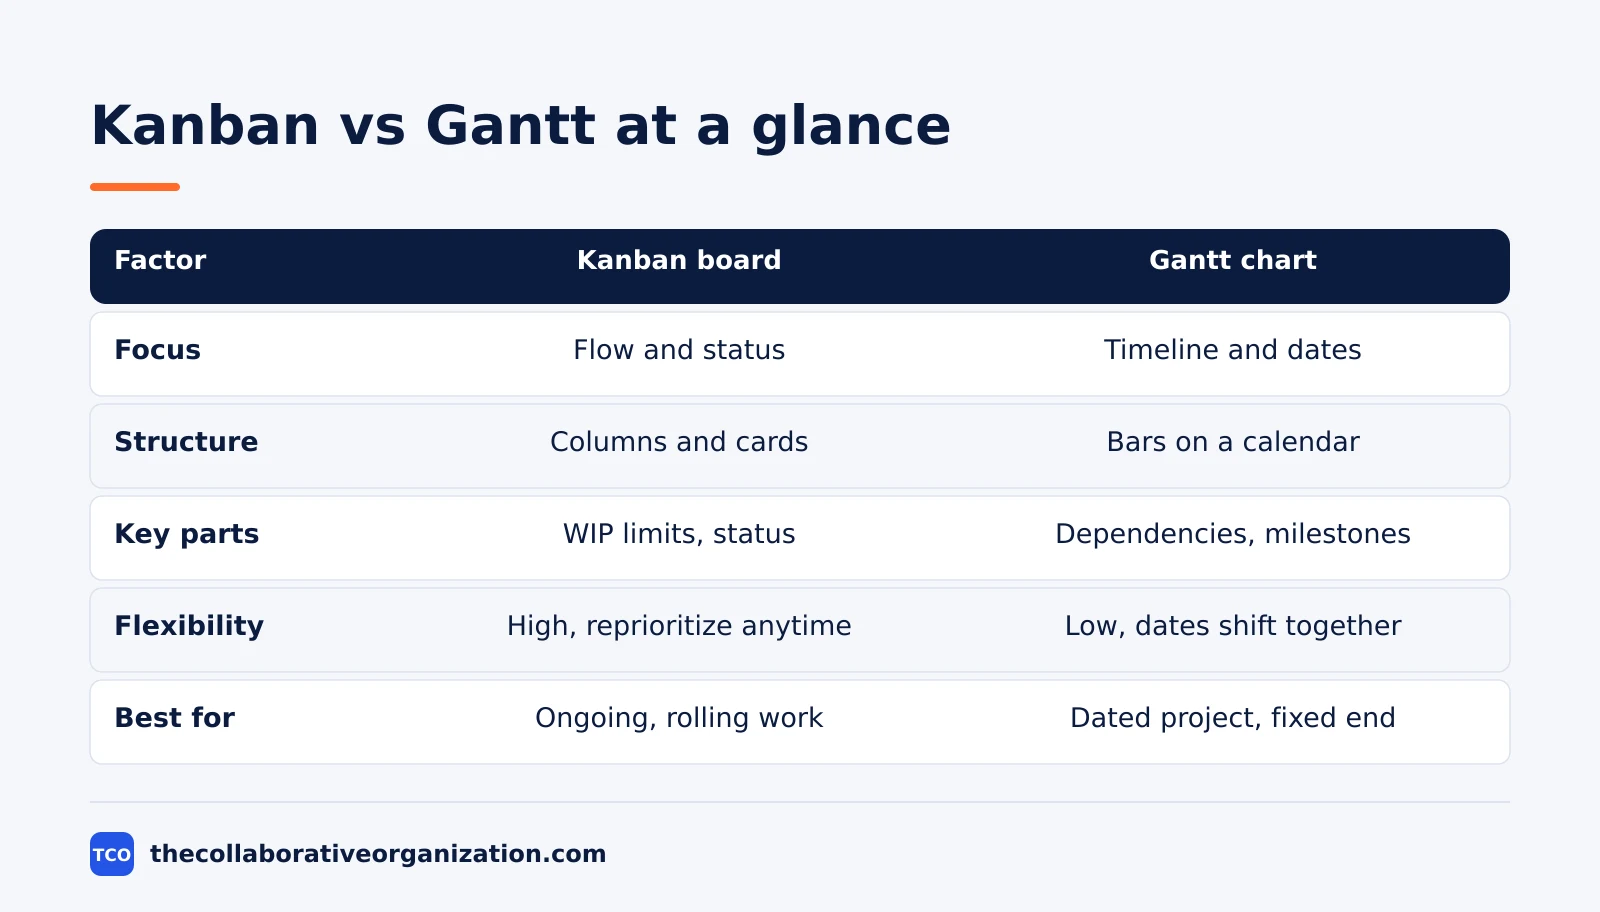
| Factor | Kanban board | Gantt chart |
|---|---|---|
| Primary focus | Workflow and flow efficiency | Timeline and scheduling |
| Structure | Columns for workflow stages | Horizontal bars on a calendar axis |
| Key elements | WIP limits, task status, continuous flow | Dependencies, milestones, start and end dates |
| Flexibility | High: add or reprioritize tasks any time | Low: one change can move the whole timeline |
| Best for | Ongoing work or repeating workflows | Time-bound projects with a clear end date |
| Main risk | Work piles up in one stage | A slipped date moves the whole plan |
The table hides one detail: a board can hold a due date on every card, so a deadline alone does not force a Gantt chart.
The chart becomes necessary when task timing forms a connected system, and one delay changes another task’s start. Teamhood puts it this way: if tasks mostly move on their own, a board is enough.
History explains the split. Gantt charts grew out of factory scheduling and construction, where order and dates rule. Kanban grew out of Toyota’s pull system, where flow and limits rule. The two tools answer the needs of the work they were born to manage.
Choose Kanban if, choose Gantt if
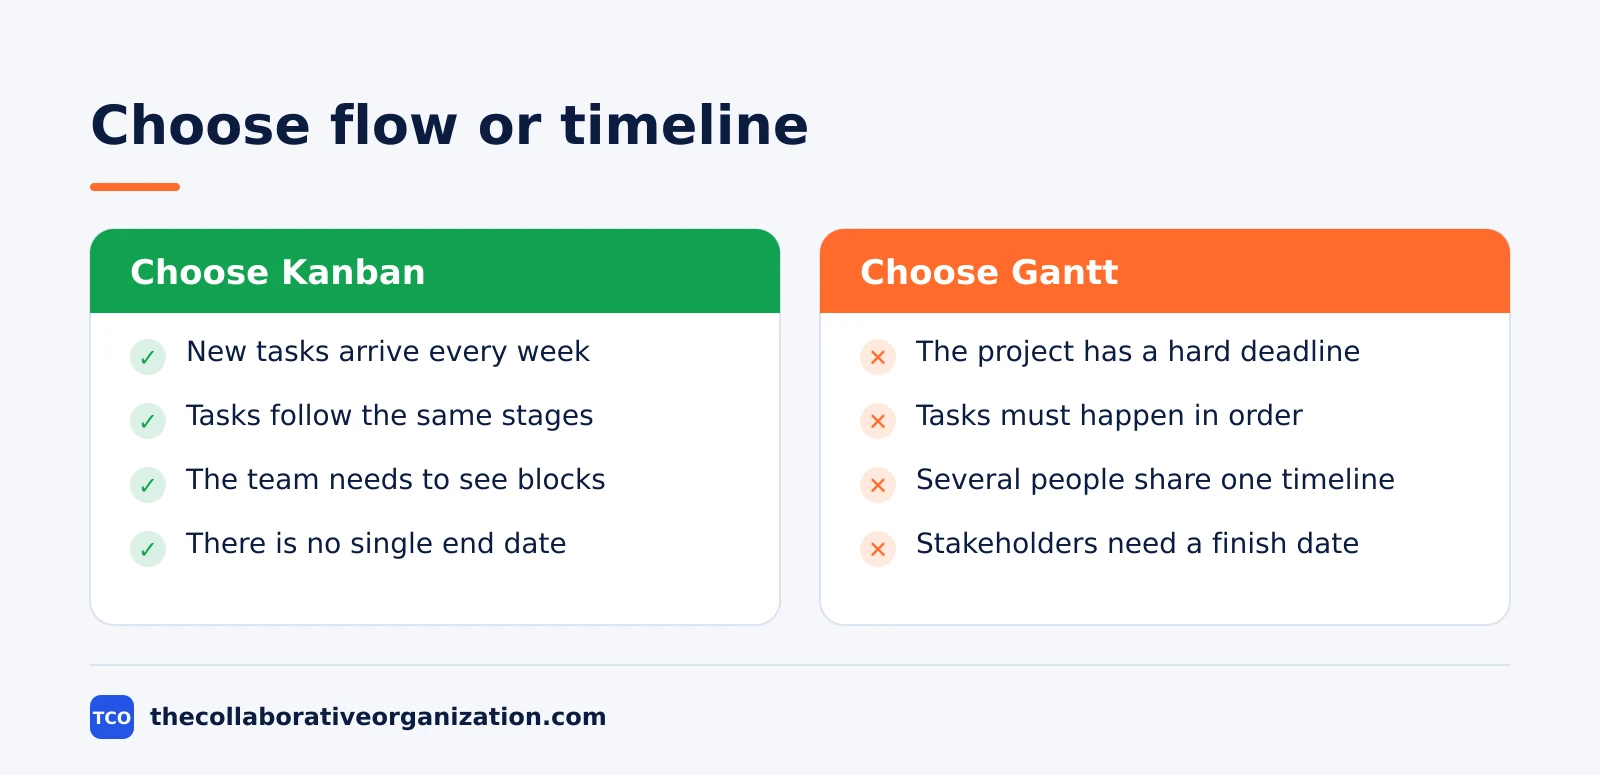
Choose Kanban when work arrives on a rolling basis, and choose Gantt when the project has a fixed deadline and a set sequence. The two conditions are easy to test before you commit to a view. If either answer is unclear, start with the board: it is faster to set up, and a timeline can be added later.
Choose Kanban if the work looks like this: new tasks arrive every week, tasks follow the same stages each time, the team needs to see what is stuck, and there is no single end date.
Support tickets, bug reports, content production and hiring pipelines all fit here. Our guide on how to set up a Kanban board covers columns, WIP limits and the first week of use.
Choose Gantt if the work looks like this: the project has a hard deadline, tasks must happen in a defined order, several people must coordinate across the timeline, and stakeholders need a finish date they can plan around. Product launches, website rebuilds, events and migrations all fit here.
When both descriptions fit, the work usually has two layers: a dated project made of rolling tasks. A launch has a fixed date, but the content inside it flows through the same stages every week. That is the case for using both views, which the next section covers.
Can you use Kanban and Gantt together?
Yes, and most teams should: the Gantt chart plans the phases, and the Kanban board runs the daily work inside each phase. The two views show the same tasks, so moving a card on the board shifts its bar on the chart. Nothing falls out of sync, because there is only one task list behind both views.
The split of jobs is simple. Use the Gantt view for planning: set the phases, the dependencies, the milestones and the finish date. Use the board for the day to day: pick the next card, move it across the stages, and cap the work in progress. A weekly review opens the Gantt chart; a daily standup opens the board.
Set it up in four steps. First, list the tasks and group them into phases with dates. Second, link the tasks that depend on each other.
Third, build the board with one column per stage and a WIP limit on the busiest column. Fourth, name one person to update the chart when dates move, so the timeline never becomes fiction.
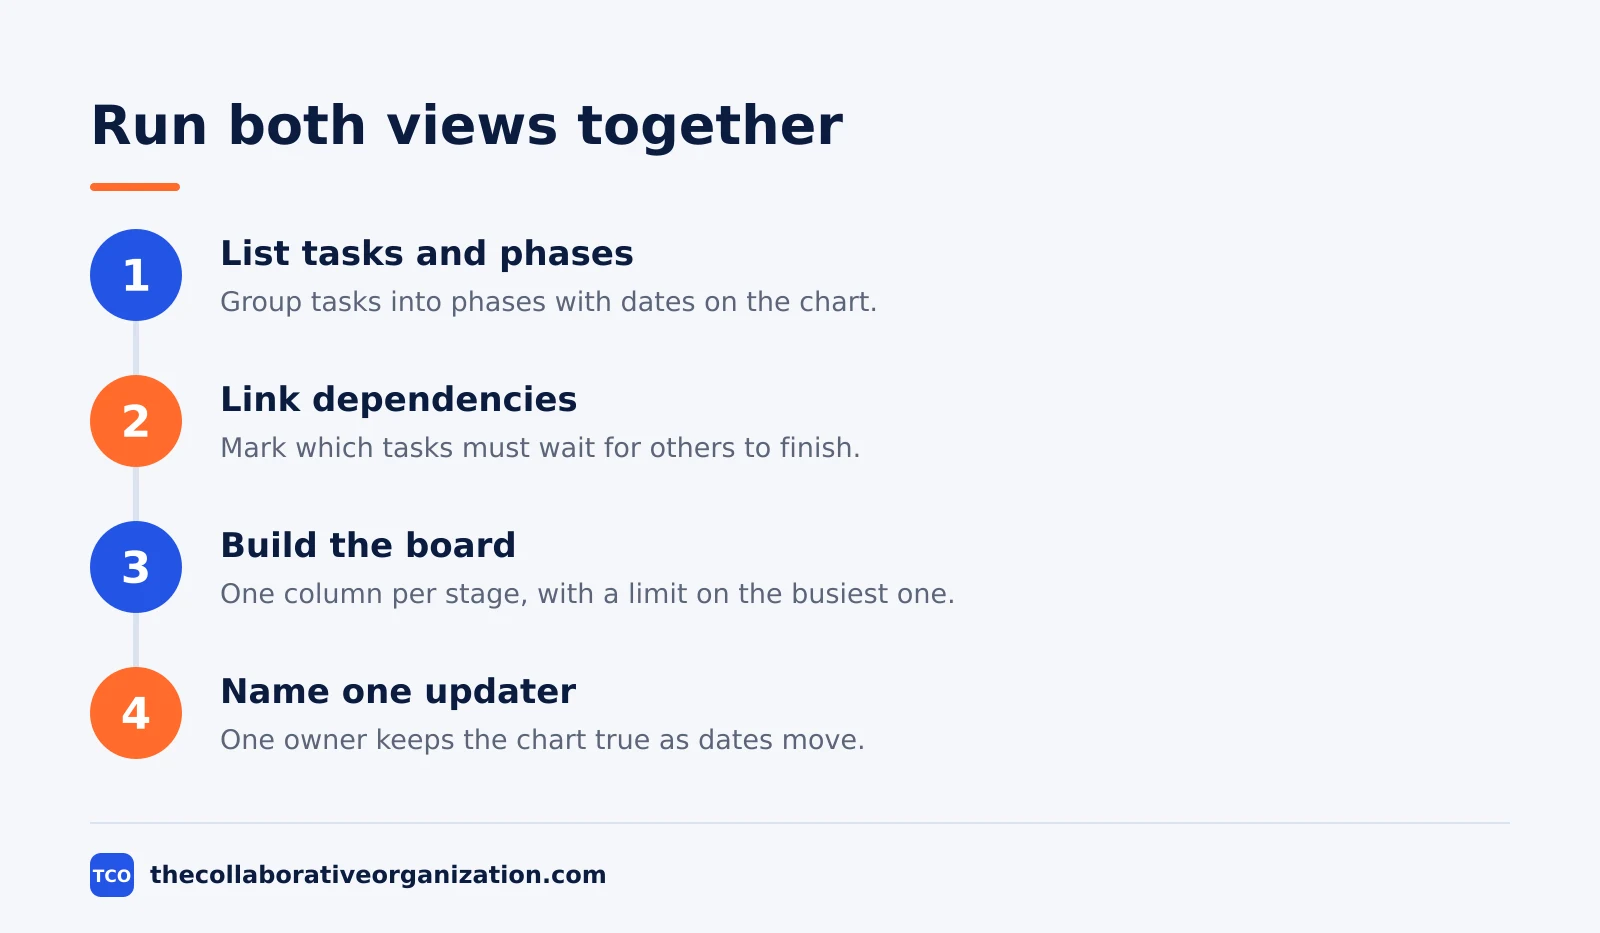
One warning applies: two views need one owner for the plan. If nobody updates the chart, the board stays true and the timeline drifts, and the team stops trusting the dates. StrategyLab makes the same point: a Gantt chart only stays useful when one person owns it and updates it as reality shifts.
Worked example: a product launch on both views
A product launch shows both views on the same work in the same four weeks. This is an illustration, not a real team. A six-person team launches a new feature on 15 December. The work has three phases: build, test and launch, with 18 tasks in total. Testing cannot start until the build ends, and the launch cannot happen until testing passes.
On the Gantt chart, the three phases sit as bars on the calendar. Build runs 17 November to 28 November, test runs 1 December to 8 December, and launch runs 9 December to 15 December. The milestone diamond sits on 15 December.
When the build slips by two days, the chart moves testing and the launch by two days, and the lead sees the new date at once.
On the board, the same 18 tasks move through four columns: To Do, In Progress, Review and Done. The team caps In Progress at 3 cards, so nobody starts a fourth task while three are still open.
On 24 November, four cards sit in Review, and the team sees the jam without a meeting: the reviewer is the bottleneck, so a second reviewer joins for two days.
The two views serve two meetings. The Monday planning meeting opens the Gantt chart and asks: are we on track for 15 December? The daily standup opens the board and asks: what is stuck, and what moves next? Neither view alone answers both questions.
Tools with Kanban and Gantt views
Four tools offer both views, but Gantt often sits above the cheapest paid tier. The table below lists real starting prices as of November 2026. Our guide on how to choose project management software covers seat counts and free-plan caps in more depth.
| Tool | Best for | Free plan | Starting price (as of November 2026) | Notable limit |
|---|---|---|---|---|
| Trello | Simple boards, light timelines | Free for up to 10 collaborators | $5 per user per month (Standard), billed annually | Timeline view needs Premium |
| Asana | Teams that want timelines and boards | Free for 2 people | $10.99 per user per month (Starter), billed annually | Free plan covers 2 people |
| ClickUp | Teams that want unlimited Gantt charts | Free Forever plan | $9 per user per month (Core), billed annually | Yearly billing needed for that price |
| monday.com | Visual boards with timelines | Free plan for up to 2 seats | $9 per seat per month (Basic), billed annually | Gantt view needs Standard at $12 |
The Trello price comes from Trello pricing, opened on 19 November 2026: Standard is $5 per user per month billed annually, and the Timeline view needs the Premium plan at $10.
The Asana price comes from Asana pricing, opened on 19 November 2026: Starter is $10.99 per user per month when billed annually, and it includes Timeline and Gantt views.
The ClickUp price comes from ClickUp pricing, opened on 19 November 2026: Core is $9 per user per month billed yearly, with unlimited Gantt charts included.
The monday.com price is $9 per seat per month billed annually for Basic, and the Gantt view starts on Standard at $12, per a November 2026 check of monday.com pricing.
Common Kanban vs Gantt chart mistakes to avoid
Most teams make the same five mistakes when they pick between the two views. Each one is easy to spot once you know the pattern.
- A Gantt chart nobody updates. The bars drift from reality within two weeks, and the team stops trusting the dates.
- A board with no WIP limit. Cards pile up in progress, nothing finishes, and the board becomes a list of started work.
- One view for every question. A board cannot show a dependency chain, and a chart cannot show a bottleneck at a glance.
- Too many tasks on the chart. A Gantt chart with 80 bars is unreadable; keep it to phases and key tasks, and let the board hold the detail.
- Copying the same work into two tools. When the board and the chart live in different apps, one copy always goes stale.
A short review fixes all five. Once a month, ask: does the chart match the real dates, does the board show the real bottleneck, and does every card sit in exactly one view of the same task list? If any answer is no, fix the setup before you add more tasks.
Sources
- StrategyLab - Gantt Chart vs Kanban Board Planning: Which to Use (2026)
- Lark - Kanban Chart: Templates and Gantt Comparison (2026)
- Workast - Kanban vs. Gantt: Which Is Better for Small Teams? (2026)
- Teamhood - Kanban Gantt Chart - Mixing the Impossible? (2026)
- Rework - The History of Kanban (2026)
- Wikipedia - Gantt chart (2025)
- Asana - Pricing (2026)
- Trello - Pricing (2026)
- ClickUp - Pricing (2026)
- monday.com - Pricing (2026)
Frequently asked questions
What is the main difference between Kanban and a Gantt chart?
Kanban shows work as it flows through stages, and a Gantt chart shows work on a timeline. Kanban answers what is in progress now and where it is stuck. A Gantt chart answers when each task starts and ends, and which tasks block the rest.
Can you use Kanban and a Gantt chart together?
Yes, and many teams do. Use the Gantt chart to plan the phases, dates and dependencies, and use the Kanban board to run the daily work inside each phase. Most project tools show the same tasks in both views, so the two stay in sync.
Is Kanban better than a Gantt chart?
Neither is better in general. Kanban fits ongoing work with rolling arrivals and repeatable stages, such as support tickets or content production. A Gantt chart fits a project with a fixed deadline, a set sequence and a clear end date.
Does a Kanban board show deadlines?
Yes. Cards can carry due dates, and most boards offer a calendar view. What a board does not show is the chain of dependencies: a card due Friday does not reveal that three other cards must finish first, and that is the job a Gantt chart does.
Which tools have both Kanban and Gantt views?
Asana, ClickUp, monday.com and Trello all offer both views on paid plans as of November 2026. Asana Starter costs $10.99 per user per month billed annually, ClickUp Core costs $9, and Trello Standard costs $5. Check the plan, because Gantt views often sit above the cheapest tier.
Related articles
guides
Free Project Management Templates: 7 to Copy (2026)
Seven free project management templates from monday, Wrike, Teamwork, Smartsheet, ClickUp, Asana and Trello, with what each one is for and what free really costs.
November 20, 2026 · 7 min read
guides
Project Proposal Template: Copy and Win Work (2026)
A project proposal template pitches the work before it is approved: problem, solution, scope, budget, timeline and terms. Copy the template and filled example.
November 20, 2026 · 10 min read
guides
Action Plan Template: Goal to Done in One Page (2026)
An action plan template turns one goal into owned steps with dates, dependencies and a success measure. Copy the table and see it filled for a support team.
November 20, 2026 · 11 min read