What Is a Gantt Chart? Definition and Parts (2026) | The Collaborative Organization
By The Collaborative Organization Team · November 19, 2026 · Last verified November 19, 2026 · 12 min read
A Gantt chart is a horizontal bar chart that maps project tasks against a timeline, so a team can see what work exists, when it happens, and what depends on what. Tasks run down the left side, dates run across the top, and each task is a bar whose position and length show its start, its duration and its end.
Key takeaways
- A Gantt chart is a bar chart of a project schedule: one row per task, one bar per task, placed on a calendar.
- Its seven parts are tasks, start date, duration, end date, timeline, dependencies and milestones.
- The chart is named after Henry Gantt, who popularised it around 1910 to 1915; Karol Adamiecki built a similar chart in 1896.
- A milestone is a zero-duration checkpoint drawn as a diamond, and a dependency is an arrow showing one task must wait for another.
- The critical path is the longest chain of dependent tasks, and its length sets the project end date.
What a Gantt chart is
A Gantt chart is a visual schedule: it turns a task list with dates into bars on a calendar, so the whole plan fits on one page. Asana defines it as a horizontal bar chart used to illustrate a project’s timeline and tasks. Each bar represents one task, and its length shows how long that task takes.
Read a chart by asking four questions:
- What work is there? One row per task.
- When does each task happen? The position of its bar.
- How long does it take? The length of its bar.
- What has to wait for what? The arrows between bars.
A chart that answers all four is a plan the team can follow without a meeting.
The chart also shows progress. Most tools shade each bar by its percent complete, so the chart doubles as a status board once work starts. A bar that is half shaded and past its end date is a delay anyone can see, which is why sponsors like Gantt charts: the state of the project is visible without reading a report.
The parts of a Gantt chart
A Gantt chart is built from seven parts, and every chart uses the same ones. Asana lists them as tasks, task start date, task duration, task end date, timeline, dependencies and milestones. Most charts add two more layers: the owner of each task, and a progress fill inside each bar.
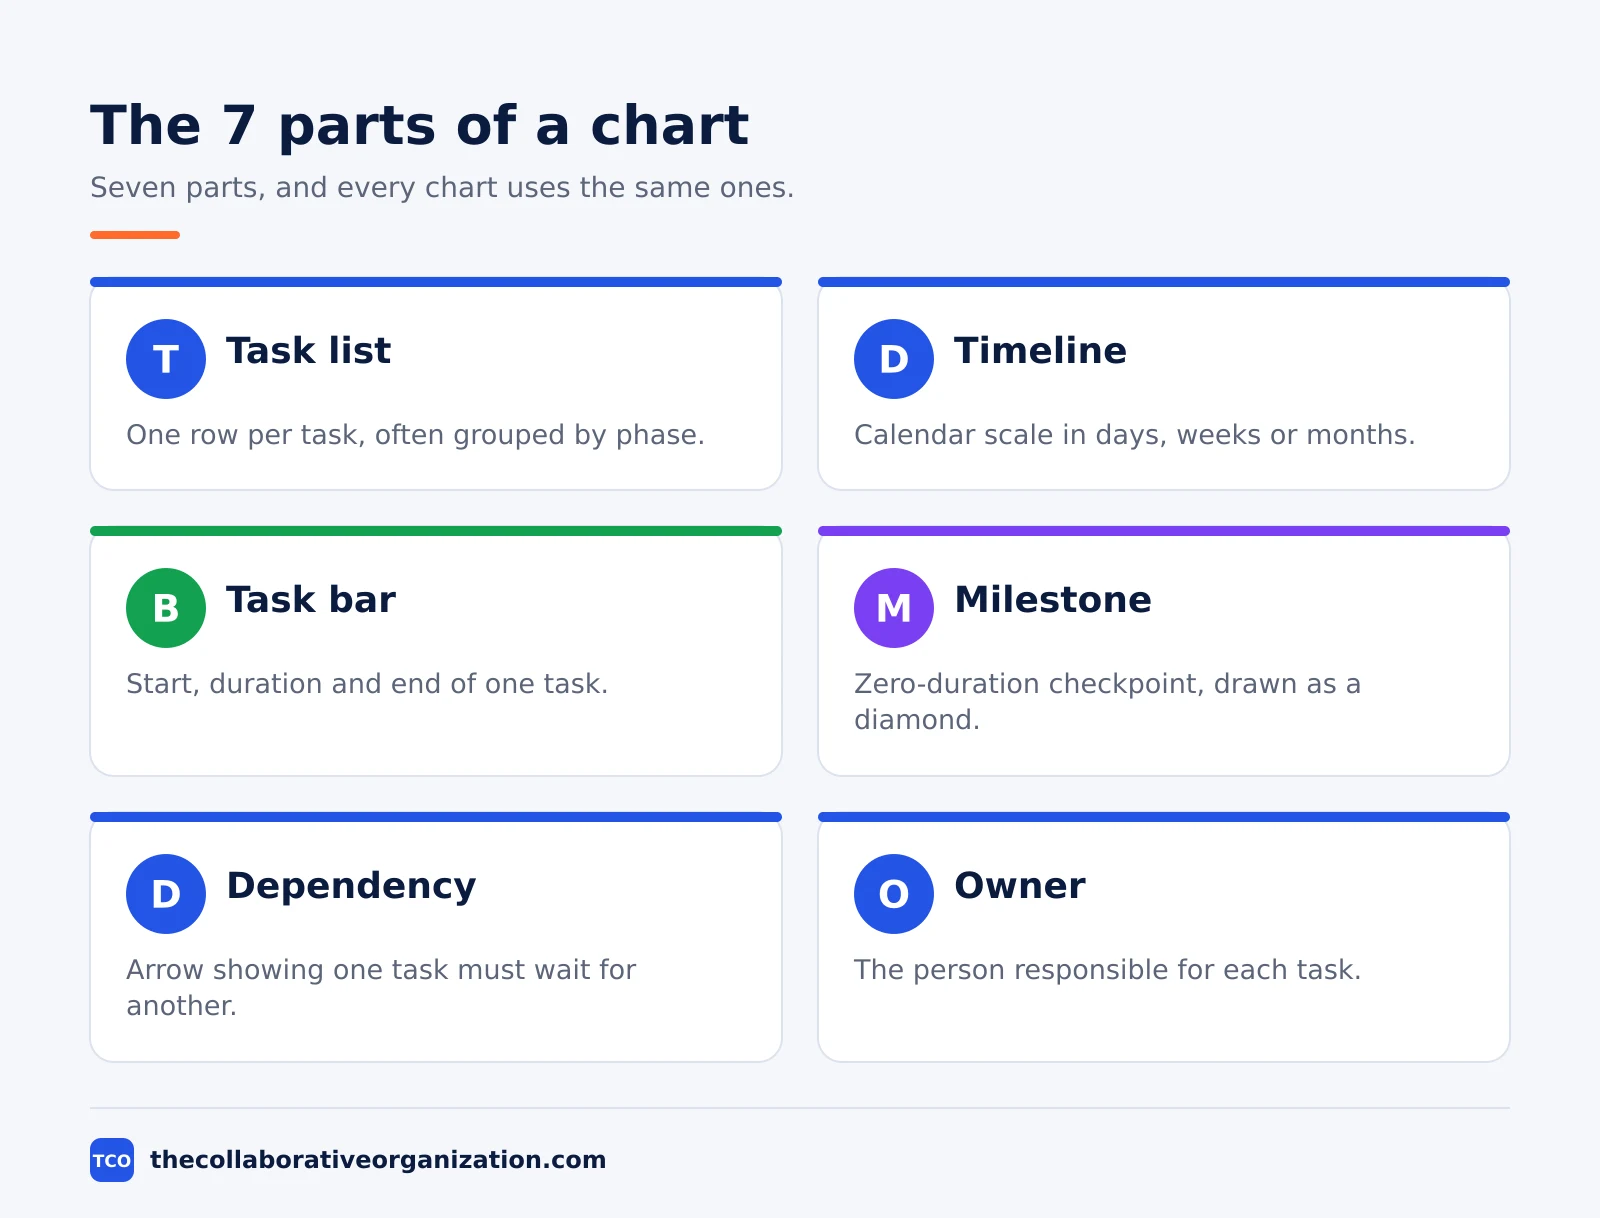
| Part | What it shows | How it is drawn |
|---|---|---|
| Task list | The work, one row per task, often grouped by phase | Left-hand column |
| Timeline | The calendar scale, in days, weeks or months | Across the top |
| Task bar | When a task starts and finishes; length is its duration | Horizontal bar |
| Milestone | A zero-duration checkpoint, such as an approval or launch | Diamond marker |
| Dependency | A task that has to wait for another | Arrow between bars |
| Owner | Who is responsible for each task | Name beside the bar |
| Progress | How much of the task is done | Shading inside the bar |
The task list is the foundation: a chart with vague tasks is a vague plan. Group the rows by phase, such as design, build and test, so the reader can follow the project in order. The timeline sets the scale, and the scale should match the project: days for a four-week sprint, weeks for a six-month build.
Milestones and dependencies are the parts teams get wrong most often. A milestone is not a task with a short duration; it is a point in time, and it takes no time itself. A dependency is not a guess about order; it is a real constraint, such as testing cannot start until the build is ready.
A short history of the Gantt chart
The chart is named after Henry Laurence Gantt, an American mechanical engineer who designed and popularised it around 1910 to 1915. Gantt built the chart to show how long factory workers spent on a given task, and it spread from factory scheduling into project work. His book Organizing for Work followed in 1919, the year he died.
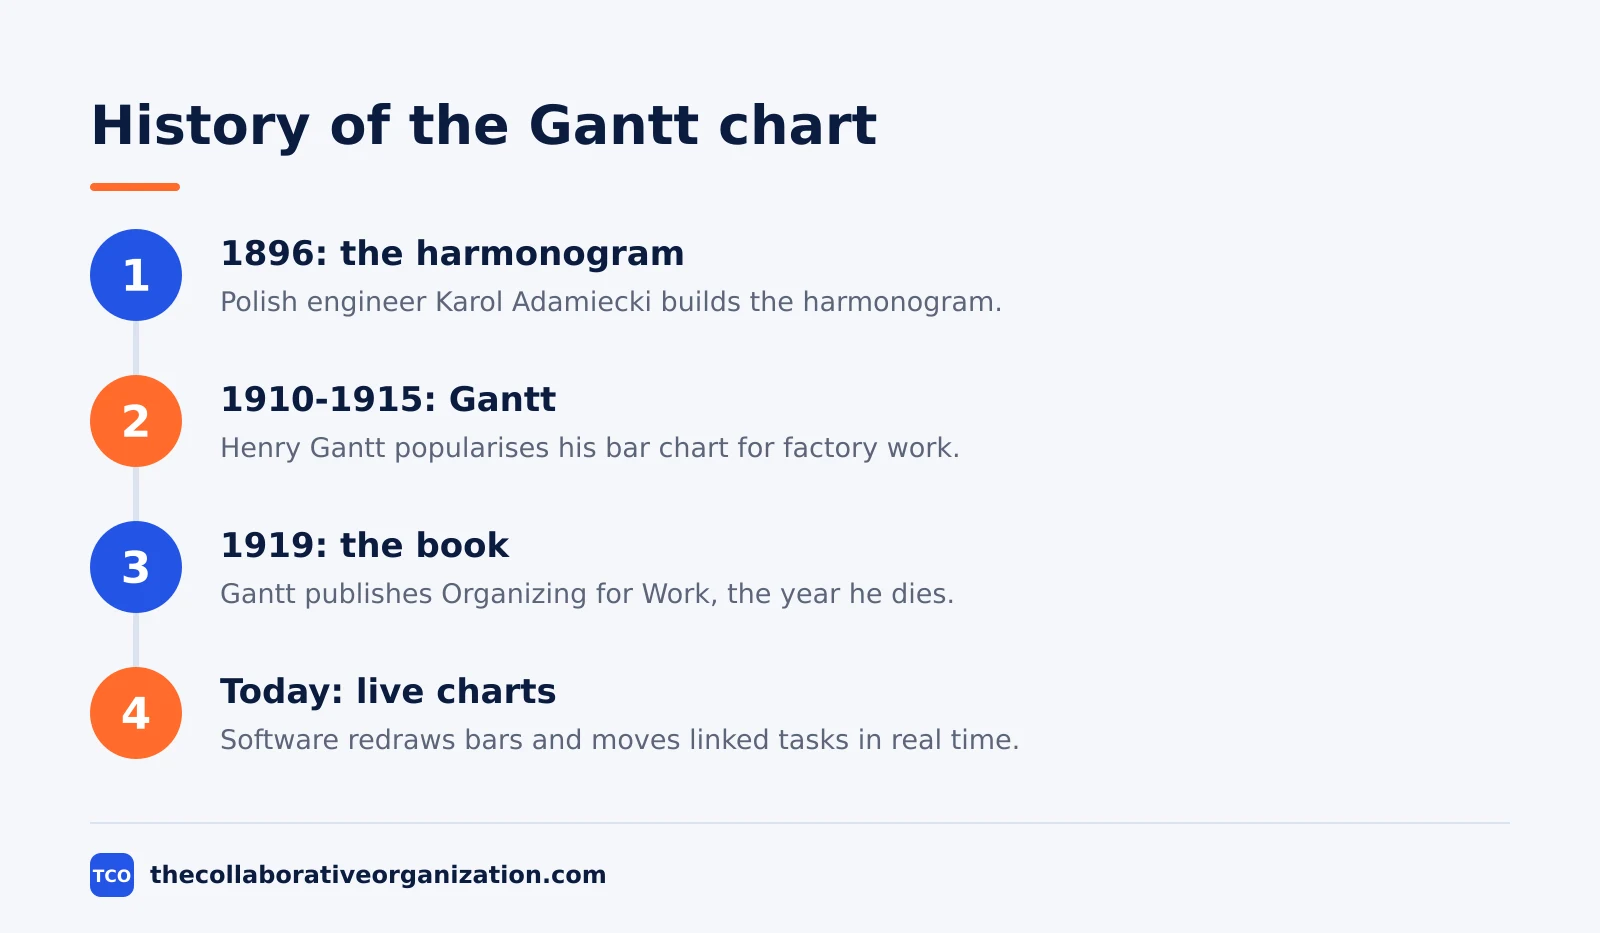
He was not the first. Polish engineer Karol Adamiecki created a similar chart in 1896, which he called the harmonogram, to show interdependent production processes. Adamiecki published his findings in Russian and Polish, which made them hard to reach in English-speaking countries, so his version stayed little known outside Poland.
Gantt’s version became the one the English-speaking world used, and his name stuck to it.
The form has barely changed in more than a century. Paper charts gave way to movable blocks, then to software that redraws bars and moves linked tasks when a date changes.
What changed is the upkeep: a paper chart had to be redrawn whenever the schedule moved, while a tool updates the bars and the dependencies in real time. The idea, a bar per task on a calendar, is the same one Gantt drew.
Dependencies and the critical path
A dependency says which end of one task controls which end of another, and the critical path is the longest chain of those links. There are four types of dependency, and most schedules use mainly the first. Finish-to-start is the default in most tools: task B starts after task A finishes, such as testing after the build.
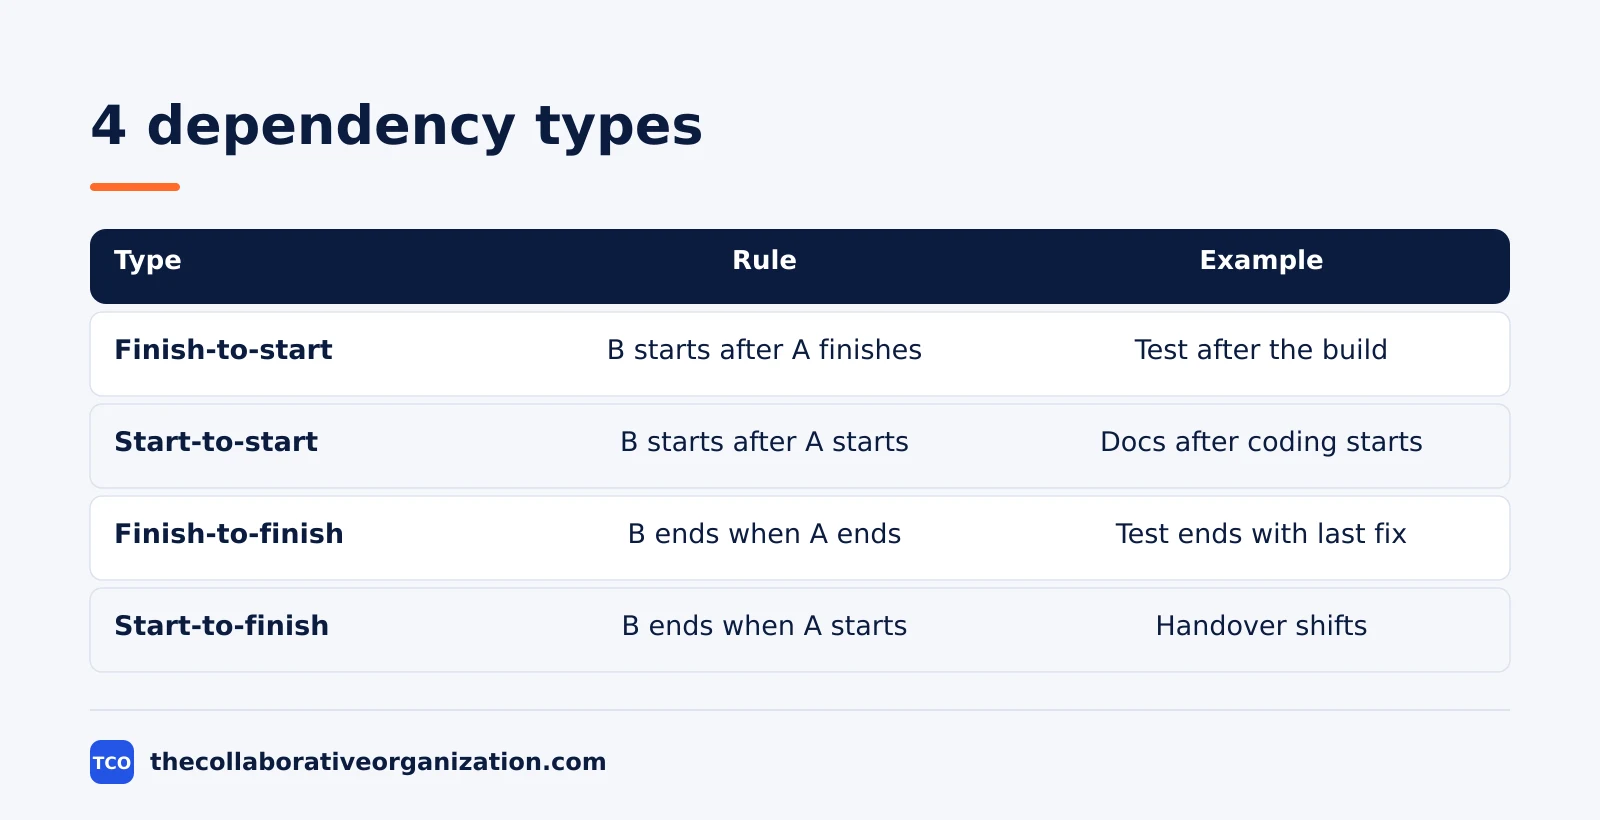
| Type | Rule | Example |
|---|---|---|
| Finish-to-start (FS) | B starts after A finishes | Test the feature after the build is done |
| Start-to-start (SS) | B starts after A starts | Start writing docs a day after coding starts |
| Finish-to-finish (FF) | B cannot finish until A finishes | Finish testing when the last fix lands |
| Start-to-finish (SF) | B cannot finish until A starts | Rare; used for handover shifts |
The critical path is the longest chain of dependent tasks in the project. Its total duration sets the project end date, so any delay to a task on the path delays the whole project. Tasks off the path have float: they can slip a little without moving the end date.
Visualizing.org explains the same idea: the longest chain of dependent tasks is the sequence whose total duration sets the project’s end date.
Link only what genuinely blocks. A chart where every task depends on the one above it is not a plan; it is a list drawn as bars. When a dependency is real, the arrow earns its place, because it explains why one delay moves three later dates.
When to use a Gantt chart, and when not to
Use a Gantt chart when the project has several phases, tasks that depend on each other, or deadlines that affect other work. It fits product launches, construction, marketing campaigns and any project where a delay in one task moves the end date. Asana lists the same uses: building complex projects, monitoring dependencies and tracking progress against milestones.
The chart is strongest as a communication tool. Show a client a timeline of deliverables and they can see what arrives when and how long each piece takes. Show a sponsor the critical path and they can see which tasks decide the end date. That shared picture is the point: the chart replaces a long status meeting with one page.
Skip the chart for a short task list with no dependencies. A two-week job with five independent tasks needs a checklist, not a timeline. A Gantt chart also struggles when dates change daily, such as in fast-moving support work, because the upkeep costs more than the picture returns.
In that case a Kanban board fits better, as our guide to kanban vs Gantt chart explains.
Gantt chart vs PERT chart vs Kanban board
A Gantt chart shows tasks on a calendar, a PERT chart shows tasks as a network of dependencies, and a Kanban board shows tasks by their current state. The three answer different questions, and teams often use two of them together. A Gantt chart answers when; a PERT chart answers what blocks what; a Kanban board answers what is in progress now.
| Tool | Shows | Best when |
|---|---|---|
| Gantt chart | Tasks as bars on a calendar | Dates and deadlines matter |
| PERT chart | Tasks as nodes linked by dependencies | The order of work is complex |
| Kanban board | Tasks as cards in columns by state | Work flows in continuously |
Our guide to PERT vs Gantt chart compares the two in depth, including when a PERT diagram shows the critical path more clearly than a bar chart. The short version is that a PERT chart is better for working out the logic of a complex schedule, while a Gantt chart is better for showing that schedule to the team.
Many teams keep both: the PERT view for planning the dependencies, and the Gantt view for tracking dates. A Kanban board then runs the daily work, with the Gantt chart marking the milestones the board must hit. The choice is not one tool for everything; it is the right view for the question being asked.
Gantt chart example: a website launch
A small website launch shows how the parts fit on one chart. Imagine a team of four launching a company website in six weeks, from 2 March to 10 April 2026. The chart below covers six tasks and two milestones, and the dates are an illustration, not a real project.
| Task | Owner | Start | End | Depends on |
|---|---|---|---|---|
| Write the site copy | Writer | 2 Mar | 13 Mar | - |
| Design the pages | Designer | 9 Mar | 27 Mar | Copy draft |
| Build the pages | Developer | 23 Mar | 3 Apr | Design sign-off |
| Test on mobile and desktop | Tester | 30 Mar | 8 Apr | Build complete |
| Launch the site | Developer | 10 Apr | 10 Apr | Testing passed |
| Announce the launch | Marketing lead | 10 Apr | 10 Apr | Launch |
Three things stand out. Design overlaps copy, because the designer can start once a draft exists; that is a start-to-start link. Build cannot start until design is signed off, so a late sign-off moves the build, the test and the launch.
The launch itself is a milestone: a diamond on 10 April, not a bar, because the launch takes no time itself. The critical path runs through design sign-off, build, test and launch, so those four tasks decide the end date.
Tools that can make a Gantt chart
A project tool draws the bars, links the dependencies and moves the linked tasks when a date changes, which is the work a spreadsheet makes you do by hand. The Gantt view is a paid feature in most tools, so check which plan includes it before you commit. Our project management software shortlist compares the options side by side.
| Tool | Best for | Free plan | Starting price (as of November 2026) | Notable limit |
|---|---|---|---|---|
| Asana | Teams that want a Timeline view linked to tasks | Free for 2 people | $10.99 per user per month (Starter), billed annually | Gantt views need Starter |
| ClickUp | Teams that want unlimited Gantt charts and custom fields | Free Forever plan | $9 per user per month (Core), billed yearly | Yearly billing needed for that price |
| Jira | Software teams that plan releases on a timeline | Free for up to 10 users | $9.70 per user per month (Standard), billed monthly | Rate applies to users 1 to 100 |
The Asana price comes from Asana pricing: the Personal plan is free for 2 users, and Starter is $10.99 per user per month when billed annually, with Timeline and Gantt views included.
The ClickUp price comes from ClickUp pricing: Core is $9 per user per month billed yearly, shown against a regular price of $12, so the $9 figure may be promotional, and Core includes unlimited Gantt charts.
The Jira price is the monthly rate for users 1 to 100 after Atlassian raised prices on 13 October 2026. Atlassian’s own pricing page returned an error when opened on 19 November 2026, so the $9.70 Standard figure rests on independent November 2026 checks of Atlassian’s published tables, not on a direct read of the page that day.
For the wider context, see our guide to what is project management. Pick the tool the team will open every day: a Gantt chart only works when the dates in it are current, and the dates stay current only in the tool where the work happens.
Common Gantt chart mistakes to avoid
Most Gantt charts fail in the same five ways, and all five are easy to spot in a review. Run through the list below each time the chart changes.
- Tasks with no owner. A bar with no name beside it is work nobody has agreed to do, and it slips first.
- Every task linked to the one above it. Link only what genuinely blocks. False dependencies hide the real critical path.
- Milestones used as tasks. A milestone takes no time. If it has a duration, it is a task, and it needs a bar, not a diamond.
- No baseline. Without a saved copy of the original plan, nobody can show what changed or why the date moved.
- A chart that is never updated. A Gantt chart with last month’s dates misleads the team more than no chart at all, because it looks like a plan.
The last mistake is the quiet one. Teams build a good chart at kickoff, then stop updating it when the work gets busy. Review the chart at each team meeting, move the bars to match reality, and save a new baseline when the sponsor agrees a date change.
A chart that matches the real work is the one the team trusts.
Sources
- Asana - What is a Gantt Chart? Guide to Project Timelines (2026)
- AFFiNE - What Is a Gantt Chart? Definition, Elements and Examples (2026)
- Visualizing.org - Gantt Chart: Definition, How To Read and When To Use It (2026)
- GanttTool - What Is a Gantt Chart? (2026)
- Asana - Pricing (2026)
- ClickUp - Pricing (2026)
- Atlassian - Jira Pricing (2026)
Frequently asked questions
What is the difference between a Gantt chart and a timeline?
A timeline is the general idea: events placed in date order. A Gantt chart is one kind of timeline, built for project work. Each task gets a bar that shows its start, its duration and its end, and arrows link tasks that depend on each other. A simple timeline shows when things happen; a Gantt chart also shows what blocks what.
When should you use a Gantt chart?
Use one when the project has several phases, tasks that depend on each other, or deadlines that affect other work. It fits product launches, construction, campaigns and any project where a delay in one task moves the end date. Skip it for a short task list with no dependencies, where a checklist does the job faster.
What is the critical path on a Gantt chart?
The critical path is the longest chain of dependent tasks in the project, and its total duration sets the project end date. Any delay to a task on the critical path delays the whole project. Tasks off the path have float, which means they can slip a little without moving the end date.
What is a milestone on a Gantt chart?
A milestone is a checkpoint with zero duration, such as an approval, a delivery or a launch. It is drawn as a diamond on the date it happens, and it takes no time itself. Milestones mark the moments the team and the sponsor will judge the project by, so they sit at the end of phases, not in the middle of tasks.
Can you make a Gantt chart in a spreadsheet?
Yes, for a small project. List the tasks down the left, put dates across the top, and shade cells to show each task's start and end. It works until the plan changes, because moving a date means reshading bars and rechecking every dependency by hand. A project tool redraws the bars and moves the linked tasks for you.
Related articles
project management
How to Choose Project Management Software (2026)
Pick project management software in seven steps: define the work, count seats, price the real cost, and run a two-week pilot before you pay.
November 19, 2026 · 10 min read
project management
What Is a RACI Matrix? Definition, Roles and Examples (2026)
A RACI matrix maps who is Responsible, Accountable, Consulted and Informed for each task. Learn the four roles, how to build one, and see a worked example.
November 19, 2026 · 9 min read
project management
Daily Standup Meeting Format That Works (2026)
A daily standup is a 15-minute meeting where Developers inspect progress toward the Sprint Goal and plan the next day. Use this format to run one that ends on time.
November 19, 2026 · 10 min read