Digital Transformation Statistics: 28 Stats (2026) | The Collaborative Organization
By The Collaborative Organization Team · November 19, 2026 · Last verified November 19, 2026 · 10 min read
Digital transformation spending keeps growing, but results still lag the money. IDC puts spending at almost $4 trillion a year by 2028, while Gartner found only 48% of digital initiatives meet their targets. The 28 statistics below cover the spend, the hit rates, the AI value gap and what the winners do differently, each with its source and year.
Key takeaways
- Digital transformation spending reaches almost $4 trillion by 2028, about 70% of all ICT spend, per IDC in 2025.
- Only 48% of digital initiatives meet or exceed their business outcome targets, per Gartner in 2024.
- The Digital Vanguard reaches 71% of initiatives meeting targets, per Gartner in 2024.
- 56% of CEOs saw neither higher revenue nor lower costs from AI in the last 12 months, per PwC in 2026.
- 89% of organizations regularly use AI in at least one business function, per McKinsey in 2026.
How we chose these 28 statistics
We picked statistics from named studies published in 2024, 2025 and 2026, and we dropped any figure we could not trace to its source. Each number below names its study and year, and the table at the end repeats all 28 with links. Vendor and analyst surveys are named as surveys, and estimates are flagged as estimates.
One sourcing note: every figure below links to the original study’s own page. The IDC Spending Guide and EMEA forecast sit behind paywalls, so those links point to IDC’s own public press releases and blog post summarizing each edition.
How big the spend is
Digital transformation is now most of what companies spend on technology. IDC, in its May 2025 update, projects digital transformation investment at almost $4 trillion by 2028, about 70% of total information and communications technology spend. AI is 17% of that spend in the same update.
The growth rate is steep. IDC’s May 2024 Spending Guide puts the compound annual growth rate at 16.2% over 2022 to 2027. The 2026 edition of the guide has published only its software slice so far, so the $4 trillion figure stays labelled with its 2025 edition.
Europe is a large share of the total. IDC’s January 2025 forecast puts EMEA spending at $1,201 billion by 2028, at a 15.8% compound annual growth rate, and calls generative AI the primary driver of digital investment in the region.
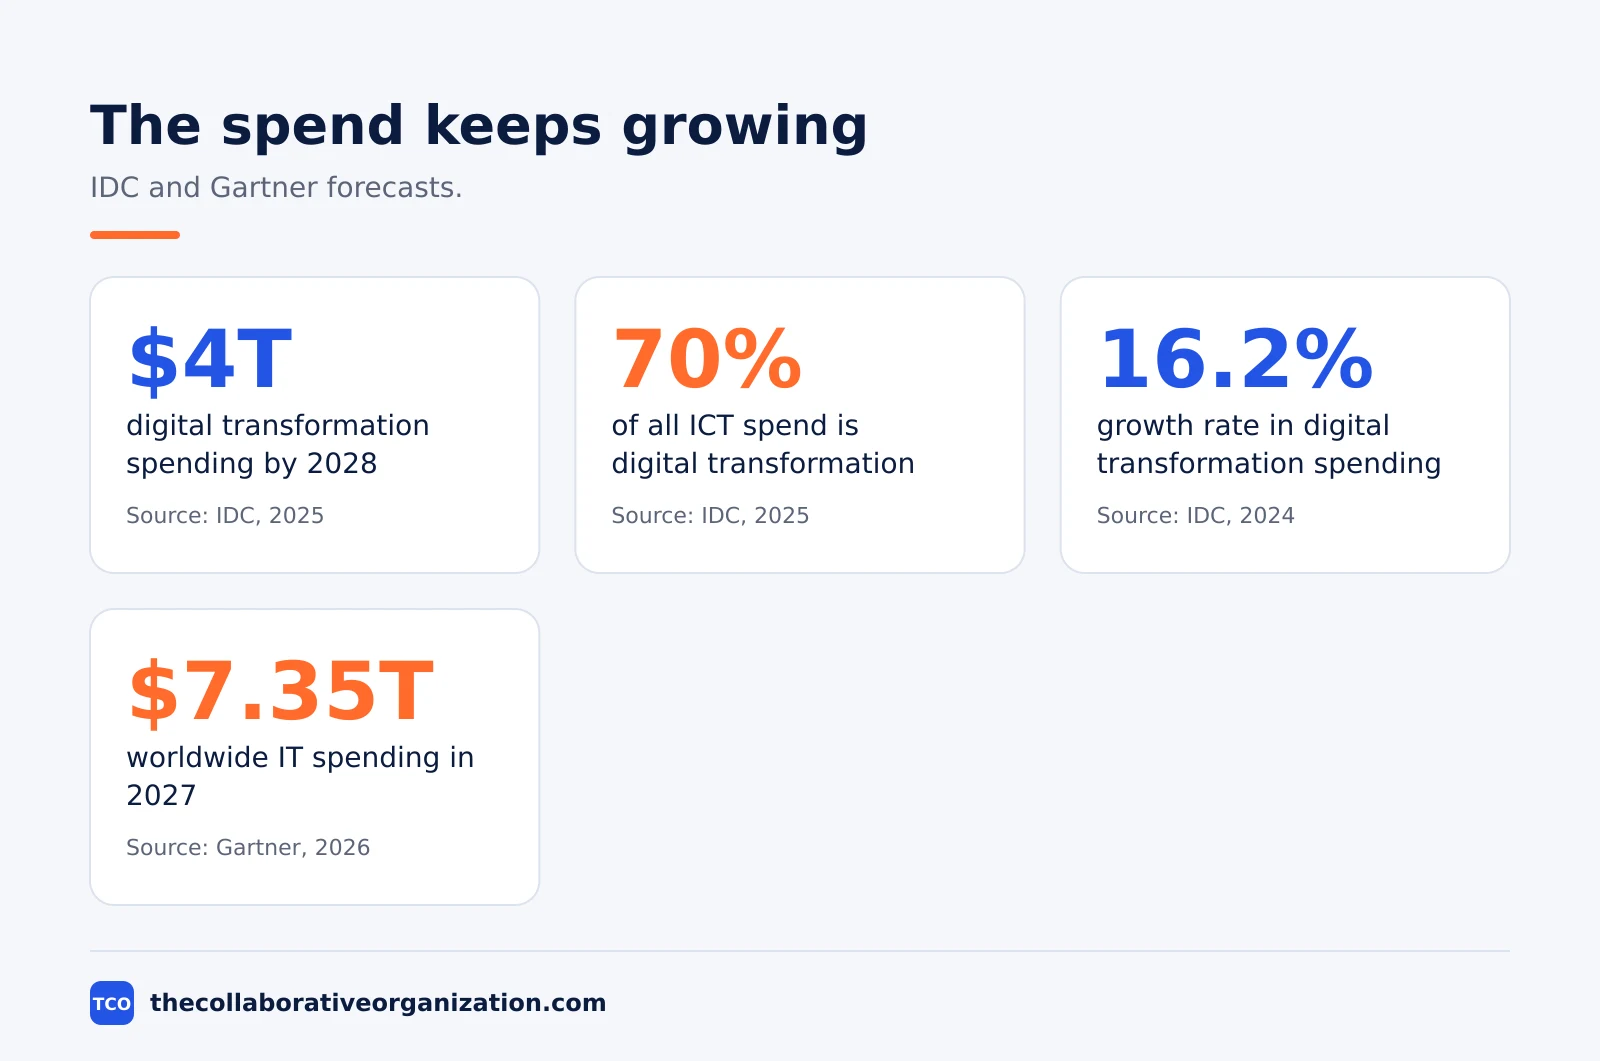
The wider envelope is bigger still. Gartner’s October 2026 forecast puts worldwide IT spending at $7.35 trillion in 2027, up 15% and crossing $7 trillion for the first time. Our SaaS statistics guide covers the software slice of that spend in detail.
How many initiatives hit their targets
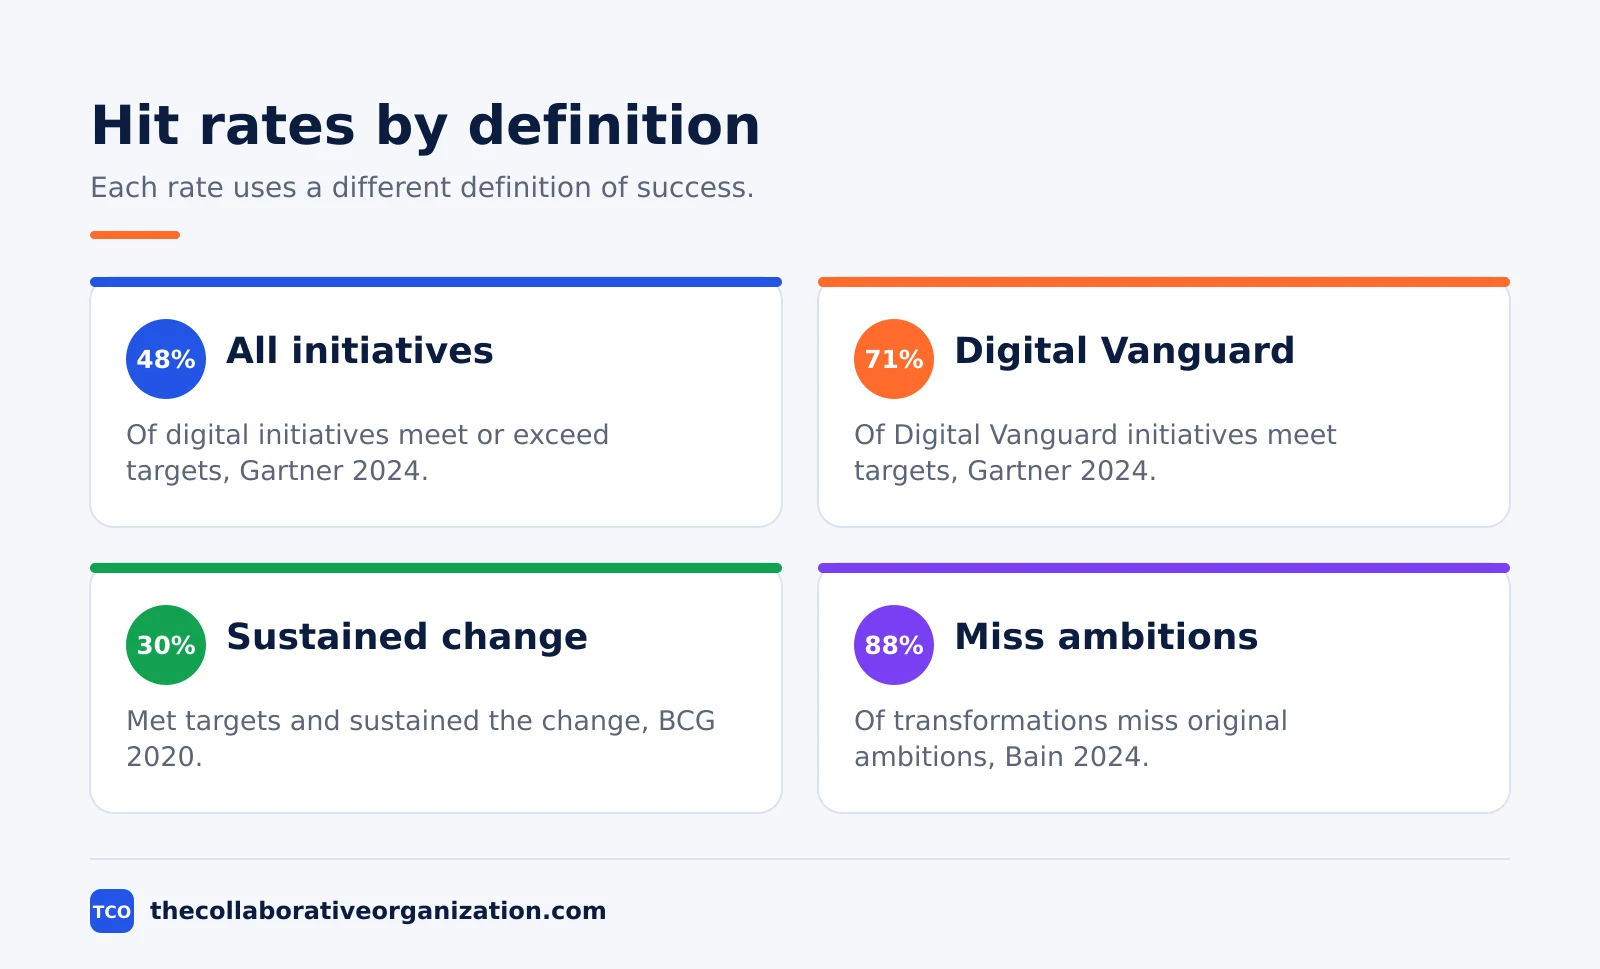
Fewer than half of digital initiatives meet the targets set for them. Gartner found only 48% of digital initiatives enterprise-wide meet or exceed their business outcome targets, in its survey of 3,186 CIOs and technology executives in 88 countries plus 1,126 executives outside IT. That means 52% fall short.
A smaller group does far better. Gartner calls it the Digital Vanguard, and 71% of its initiatives meet or exceed their targets. The difference is not a bigger budget: Vanguard CIOs and business leaders co-own digital delivery end to end, and Vanguard CxOs dedicate 35% of their business-area staff to technology work, against 21% for other CxOs.
Other definitions give other rates, and that is the point. BCG found 30% of digital transformations met targets and sustained the change in its 2020 study.
Bain found 88% of business transformations fail to achieve their original ambitions in its 2024 survey. The stricter the definition of success, the lower the rate.
The skills gap sits underneath the miss rate. Gartner found only 16% of CIOs prioritize building a technology workforce enterprise-wide in 2025, and only 18% prioritize sharing technology leadership with other business areas. Our project management statistics guide covers the delivery side of the same problem.
The AI value gap
AI use is nearly universal, and AI profit is not. McKinsey found 89% of organizations regularly use AI in at least one business function in its 2026 global survey, and 44% report AI scaling across the enterprise, up from 38% a year ago. Yet only 37% attribute at least some profit impact to AI use.
The gap is widest at the top. PwC found 56% of CEOs saw neither higher revenue nor lower costs from AI in the last 12 months, in its 29th Global CEO Survey of 4,454 CEOs in 95 countries. Only 12% reported both higher revenue and lower costs, while 30% reported increased revenue.
Individuals feel the benefit even when the company does not. McKinsey found 80% of respondents say AI has improved their own productivity. The gains are real at the desk and missing from the profit line, which is the central puzzle of this whole topic.
Some companies are already building instead of buying. McKinsey found 32% of respondents decided against buying at least one software product or feature because they could build it in-house with agentic coding tools. Our AI productivity statistics guide covers which AI habits pay off and which do not.
What the winners do differently
The winners treat transformation as a people programme with a technology budget, not the other way round. McKinsey found only 6% of respondents are AI high performers, the group that attributes at least 5% of profit to AI and calls the impact significant. High performers redesign workflows around AI instead of inserting AI into old ones.
Maturity shows up in measurement. Deloitte found 67% of Transformers report large or very large returns across all 46 of its digital KPIs, against 61% of Automators, in its 2025 Tech Value Survey of nearly 550 leaders. Transformers also report the strongest AI returns, at 72%, outpacing Automators by 5 points.
Budgets follow the same split. Deloitte found digital budgets rose from 7.5% of revenue in 2024 to 13.7% in 2025 at companies with at least $500 million in revenue. Transformers allocate more of that budget to monetization: 74% of them put 21 to 50% of their digital budget there, against 69% of Automators.
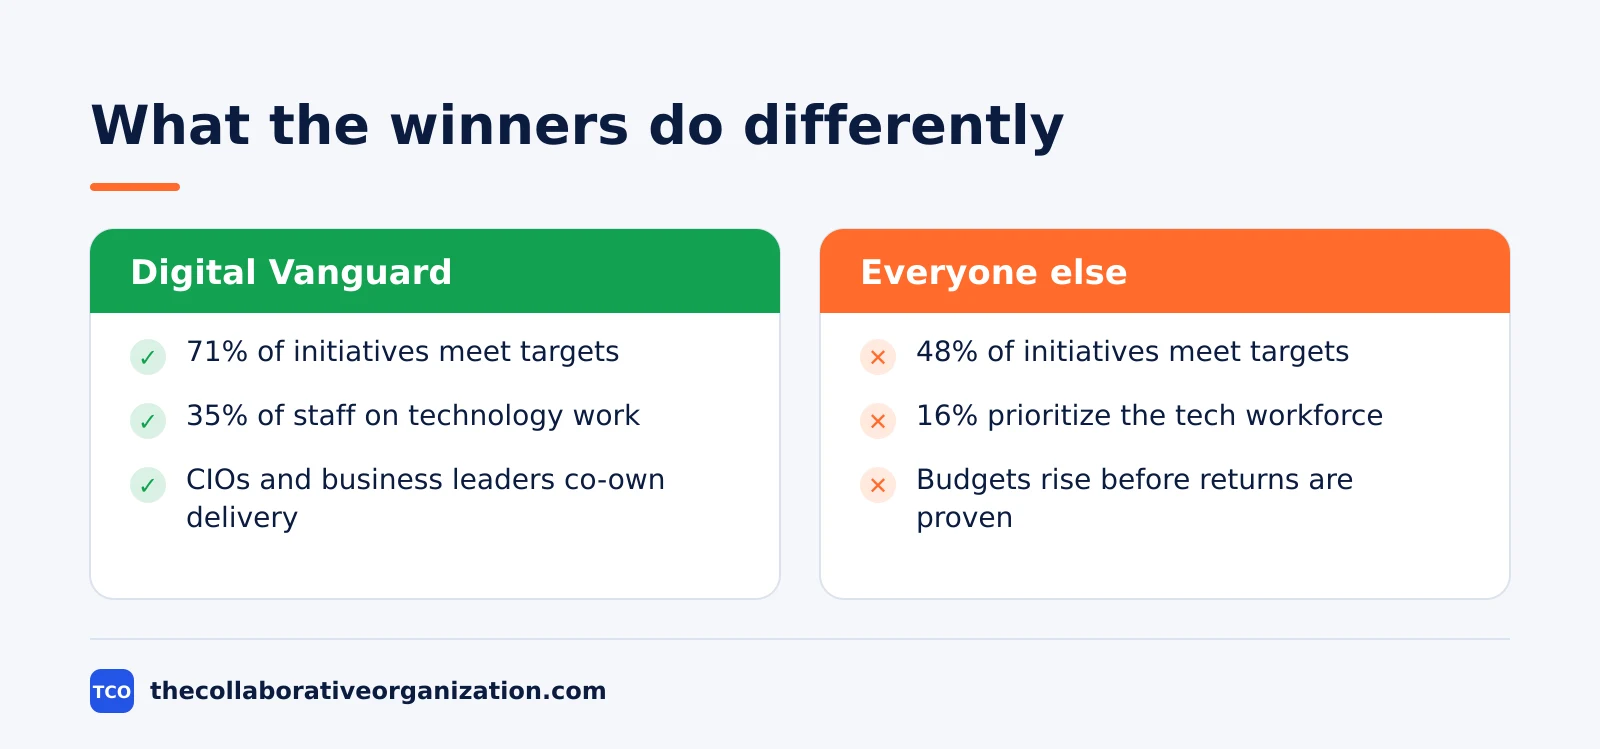
The money is moving even where the returns are not yet proven. Gartner found 75% of CFOs are raising technology budgets in 2026. Spending is not the constraint; turning spend into changed work is. Our remote work statistics guide covers one of the biggest changes in how that work happens.
The 28 digital transformation statistics in one table
The table below lists all 28 statistics with their source and year. Figures that describe a subgroup say so in the statistic itself.
| Statistic | Source | Year |
|---|---|---|
| Almost $4 trillion digital transformation spending by 2028 | IDC | 2025 |
| About 70% of total ICT spend is digital transformation | IDC | 2025 |
| 16.2% CAGR in digital transformation spending, 2022-2027 | IDC | 2024 |
| $1,201 billion EMEA spending by 2028 | IDC | 2025 |
| 17% of digital transformation spend goes to AI | IDC | 2025 |
| 48% of digital initiatives meet or exceed business outcome targets | Gartner | 2024 |
| 71% of Digital Vanguard initiatives meet or exceed targets | Gartner | 2024 |
| 35% of business-area staff on technology work (Vanguard CxOs) vs 21% (others) | Gartner | 2024 |
| 16% of CIOs prioritize building a technology workforce enterprise-wide | Gartner | 2024 |
| 18% of CIOs prioritize sharing technology leadership | Gartner | 2024 |
| $7.35 trillion worldwide IT spending in 2027 | Gartner | 2026 |
| 75% of CFOs raising technology budgets in 2026 | Gartner | 2026 |
| 89% of organizations regularly use AI in at least one function | McKinsey | 2026 |
| 44% report AI scaling across the enterprise | McKinsey | 2026 |
| 37% attribute at least some EBIT impact to AI use | McKinsey | 2026 |
| 80% say AI improved their individual productivity | McKinsey | 2026 |
| 32% decided against buying software to build with AI coding tools | McKinsey | 2026 |
| 6% of respondents are AI high performers | McKinsey | 2026 |
| 56% of CEOs saw neither higher revenue nor lower costs from AI | PwC | 2026 |
| 30% of CEOs report increased revenue from AI | PwC | 2026 |
| 12% of CEOs report both cost and revenue benefits from AI | PwC | 2026 |
| 30% of CEOs confident about revenue growth over 12 months | PwC | 2026 |
| 67% of Transformers vs 61% of Automators report large or very large ROI | Deloitte | 2025 |
| 72% AI and gen AI ROI reported by Transformers | Deloitte | 2025 |
| Digital budgets rose from 7.5% to 13.7% of revenue, 2024 to 2025 | Deloitte | 2025 |
| 74% of Transformers vs 69% of Automators allocate 21-50% of digital budget to monetization | Deloitte | 2025 |
| 88% of business transformations fail to achieve original ambitions | Bain | 2024 |
| 30% of digital transformations met targets and sustained the change | BCG | 2020 |
What the numbers mean for your team
The pattern is clear: spend is up, use is up, and measured value is concentrated in a small group that changes how work is done. The fix is not a bigger budget. It is co-owned delivery, a workforce plan, and a stopping rule for pilots that never reach production. Start with one workflow, redesign it around the new tool, and measure the outcome before scaling.
Worked example: a 500-person company counts its digital budget
Take a 500-person company with $100 million in revenue as an illustration. At 13.7% of revenue on digital initiatives (Deloitte, 2025), the company spends $13.7 million a year. At Gartner’s 48% hit rate, about $6.6 million of that spend sits in initiatives that meet their targets, and about $7.1 million sits in ones that fall short. The numbers are an illustration from the published figures, not a measurement of a real company.
One change does most of the work. Name a business owner and a technology owner for each initiative, jointly accountable for the outcome. See our guides index for the delivery guides that support that change.
Common digital transformation statistics mistakes to avoid
Most bad takes on these numbers come from the same five errors, and all five are easy to avoid.
- Quoting the 70% failure rate as measured. No study measured it; the measured rates are 52% short of targets (Gartner), 70% short of targets plus sustained change (BCG) and 88% short of original ambitions (Bain).
- Comparing hit rates without naming the definition. Gartner, BCG and Bain count different kinds of success, so their rates cannot be ranked as if they were the same test.
- Treating AI use as AI value. McKinsey found 89% use AI but only 37% report any profit impact, and PwC found only 12% of CEOs saw both cost and revenue benefits.
- Adding IDC spending to Gartner spending. IDC counts digital transformation investment and Gartner counts all IT spending, so the two totals overlap and cannot be added.
- Reading Deloitte’s 13.7% as all technology spend. It is the budget for digital initiatives at companies with $500 million or more in revenue, not total technology investment.
Sources
- IDC - Navigating Digital Transformation Amid Economic Uncertainty (2025)
- Gartner - Gartner Survey Reveals That Only 48% of Digital Initiatives Meet or Exceed Their Business Outcome Targets (2024)
- Gartner - Gartner Forecasts Worldwide IT Spending to Grow 15% in 2027, Totaling $7.35 Trillion (2026)
- Gartner - Gartner Research Reveals CFOs’ Budget Plans Prioritize Growth Functions, Technology and AI in 2026 (2026)
- McKinsey - The State of AI: Global Survey 2026 (2026)
- PwC - PwC 2026 Global CEO Survey (2026)
- Deloitte - AI maturity and digital value (2026)
- Deloitte - AI is capturing the digital dollar. What’s left for the rest of the tech estate? (2025)
- BCG - Flipping the Odds of Digital Transformation Success (2020)
- Bain - 88% of Business Transformations Fail to Achieve Their Original Ambitions (2024)
Frequently asked questions
How much is spent on digital transformation?
IDC puts digital transformation spending at almost $4 trillion a year by 2028, about 70% of all technology spending. The figure grows at a 16.2% compound annual rate in IDC's May 2024 guide. Gartner puts the wider IT spending envelope at $7.35 trillion in 2027, crossing $7 trillion for the first time.
What share of digital initiatives hit their targets?
About 48% of digital initiatives meet or exceed their business outcome targets, according to Gartner's survey of 3,186 CIOs and technology executives. A smaller group Gartner calls the Digital Vanguard reaches 71%. The definition matters: BCG counts only 30% meeting targets and sustaining the change, while Bain counts 12% achieving every original ambition.
Why do so many digital transformations fail?
People, not technology, in every dataset that asked. Bain found the strongest predictor of success is how well a company retains, develops and acquires talent. Gartner found the Digital Vanguard wins by co-owning delivery between CIOs and business leaders, and BCG found sustained change needs six factors together, not one fix.
Has AI paid off for companies yet?
For most, not yet in money terms. PwC found 56% of CEOs saw neither higher revenue nor lower costs from AI in the last 12 months, and only 12% saw both. McKinsey found 37% of organizations attribute at least some profit impact to AI, while 80% of individuals say AI improved their own productivity.
Is it true that 70% of digital transformations fail?
No measured study says that. The 70% line traces to an unscientific estimate in a 1993 book, repeated without a source ever since. Measured rates depend on the definition: 52% fall short of business targets in Gartner's survey, 70% fall short of meeting targets and sustaining change in BCG's study, and 88% miss their original ambitions in Bain's survey.
Related articles

guides
Free Project Management Templates: 7 to Copy (2026)
Seven free project management templates from monday, Wrike, Teamwork, Smartsheet, ClickUp, Asana and Trello, with what each one is for and what free really costs.
November 20, 2026 · 7 min read

guides
Project Proposal Template: Copy and Win Work (2026)
A project proposal template pitches the work before it is approved: problem, solution, scope, budget, timeline and terms. Copy the template and filled example.
November 20, 2026 · 10 min read

guides
Action Plan Template: Goal to Done in One Page (2026)
An action plan template turns one goal into owned steps with dates, dependencies and a success measure. Copy the table and see it filled for a support team.
November 20, 2026 · 11 min read