Agile Adoption Statistics: 50+ Numbers That Matter (2026) | The Collaborative Organization
By The Collaborative Organization Team · November 19, 2026 · Last verified November 19, 2026 · 14 min read
Agile adoption statistics show a method that is widely used but rarely deep: 74% of organisations use hybrid agile models, yet only 13% say agile is deeply embedded across the business. The numbers below come from the 18th State of Agile Report (2025) and other named studies, with source and year for each figure.
Key takeaways
- In 2025, 74% of organisations used hybrid, blended or homegrown agile models, and only 13% had agile deeply embedded across the business.
- AI use in agile delivery jumped from 68% to 84% in one year, while only 49% of organisations had AI guardrails in place.
- Scrum is the most used team framework at 63% of agile teams, and SAFe is the most used scaling framework at 44%.
- In the 17th State of Agile Report, agile reached IT in 69% of organisations, marketing in 19% and HR in 17%.
- Hybrid project approaches rose 57% since 2020, and purely predictive approaches fell 24% over three years.
- In the PwC Luxembourg Agile Survey 2024, 74% of companies named difficulty in coordination as a setup problem.
How we chose these stats
We chose stats only from the original study or its publisher, and we skipped any figure we could not trace to that source. The main source is the 18th State of Agile Report from Digital.ai, published 28 October 2025, based on a survey of nearly 350 people, mostly agile coaches and consultants from large enterprises with more than 20,000 employees. That small, senior sample means the figures show direction among large enterprises, not exact shares for all companies.
Older figures come from the 17th State of Agile Report, summarised by Plaky, which names each original report for every figure it quotes.
PwC Luxembourg figures come from its Agile Survey 2024, Kanban figures from the State of Kanban Report 2022, and certification counts from Scrum.org, all as quoted by Plaky with the original named.
PMI figures come from Pulse of the Profession 2025, as reported by PM Study Circle and WorkIntelHub.
Where two summaries disagreed, we used the figure the publisher itself stated.
Adoption: how far agile has spread
Agile is now the default way of working in large organisations, but most of it is hybrid rather than a single framework. In the 18th State of Agile Report (2025), 74% of organisations said they use hybrid, blended or homegrown agile models. That figure rose from about 10% using such a mix years ago, according to a summary of the same report by Pawel Rola.
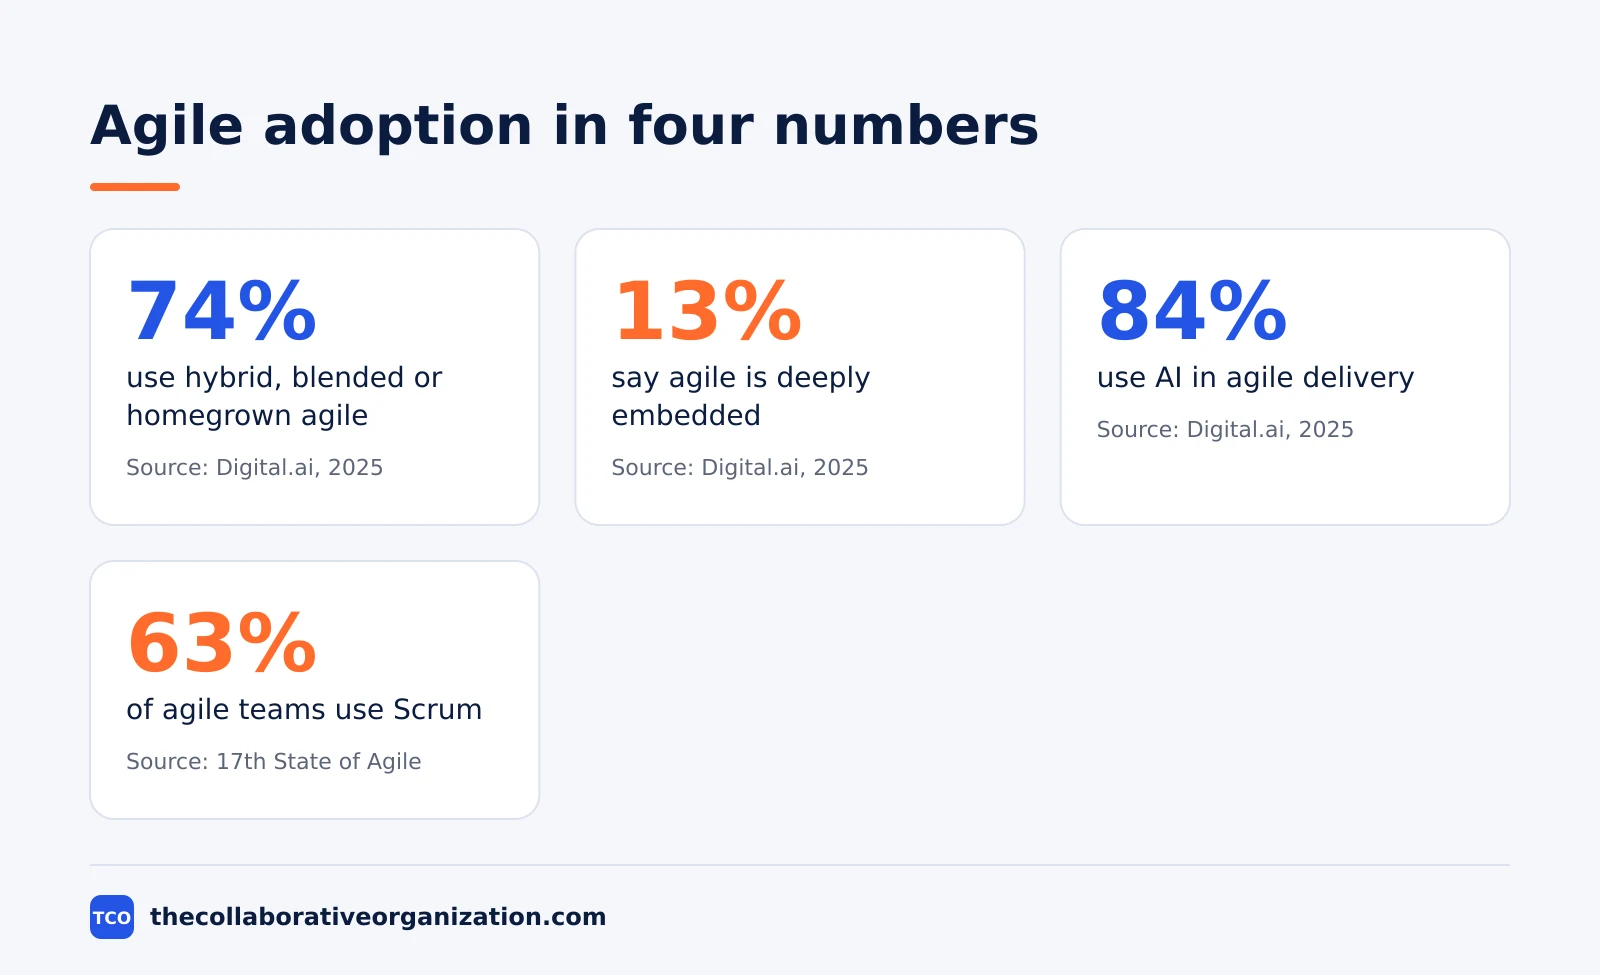
Depth lags behind spread. In the same 2025 report, only 13% of respondents said agile is deeply embedded across business, technology and supporting functions.
Another 25% said agile is practised across some departments but inconsistently, 22% said it is scaled across IT with limited business involvement, and 20% said it is limited to team-level execution. A further 7% were transitioning from traditional delivery, and 7% were reevaluating agile in light of new complexity such as AI.
Investment is still rising.
In the 18th report, 41% of organisations increased their agile spending over the past two years: 17% increased it significantly and 24% somewhat, while 27% kept it about the same and 24% cut it.
Hybrid delivery also grew in PMI data: hybrid approaches rose 57% since 2020, while purely predictive approaches fell 24% over three years, according to Pulse of the Profession 2025.
Which teams use agile
Agile is strongest in IT and software, and thins out steadily as you move into business functions. In the 17th State of Agile Report, agile was used in IT in 69% of organisations and in software development and delivery in 68%. Engineering, product, research and development followed at 48%, then business operations at 28% and customer support and services at 22%.
Marketing and HR sit lower down the same list.
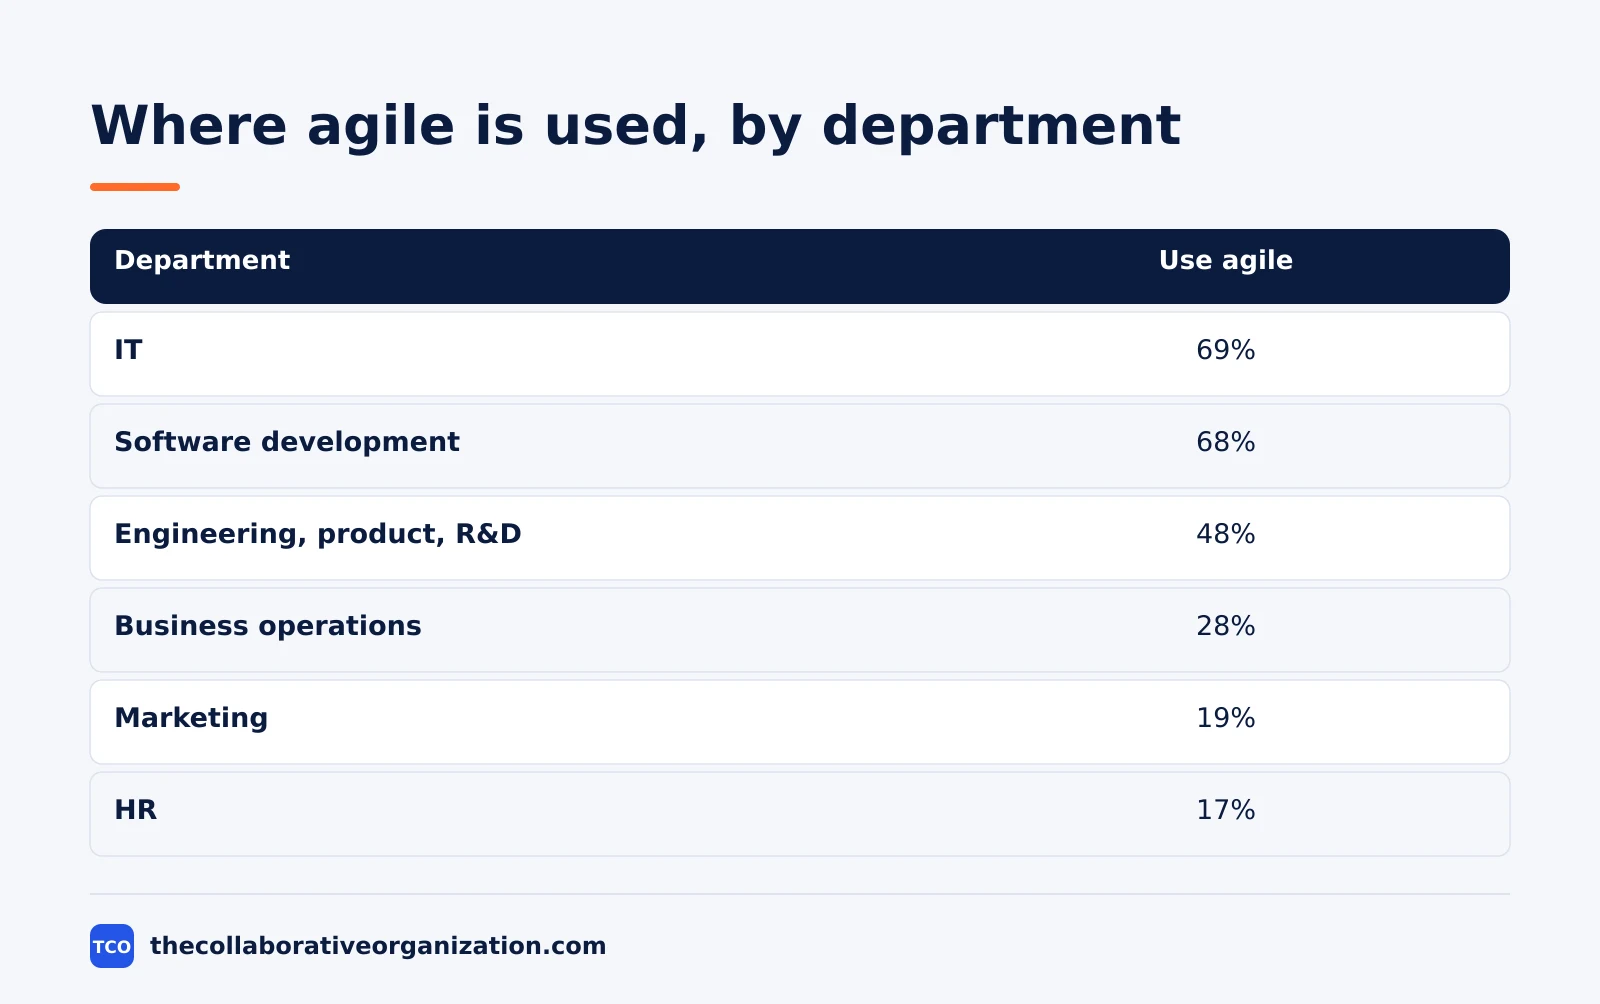
In that 17th report, marketing used agile in 19% of organisations and HR in 17%, with finance and accounting at 13% and sales at 12%.
Small companies buck the pattern in two places: customer support used agile in 33% of small companies against 16% in medium and 20% in large ones, and sales used it in 23% of small companies against 5% in medium and 10% in large ones.
Our guide to agile for non-software teams explains how those business teams adapt the method.
Frameworks: Scrum, Kanban and SAFe
Scrum is the most used team framework, Kanban is the most used flow method, and SAFe is the most used scaling framework. In the 17th State of Agile Report, 63% of agile teams said they use Scrum. In the 18th report (2025), SAFe adoption stood at 44%, usually mixed with other approaches rather than used alone. Learn how the two team methods differ in our Kanban vs Scrum guide.
Kanban spreads unevenly inside companies. In the State of Kanban Report 2022, only 13% of organisations used Kanban in all teams, while 32% used it in 2 to 5 teams and 31% in more than 10 teams.
Most Kanban users came from another method: 57% had used Scrum before, 35% had used Waterfall, and 37% had no clear way of managing work before Kanban.
Expansion plans are strong, with 87% of Kanban users planning to expand in the next year: 27% within the same areas and 60% within the same and other areas, while 14% planned no expansion.
Why organisations adopt agile
Customer value and speed top the list of reasons to adopt agile, ahead of digital transformation and predictability. In the 17th State of Agile Report, 41% of organisations named prioritising, delivering and measuring incremental customer and business value, and the same share, 41%, named accelerating time to market. Digital transformation followed at 34%, delivery predictability at 30%, and managing distributed teams better at 18%.
Smaller reasons still matter to a minority. New feature availability and product predictability each scored 14% in the 17th report, lowering risk and increasing revenue each scored 13%, and managing cost scored 12%. Only 6% said none of the listed reasons applied, and 4% were not sure.
The pattern is clear: teams adopt agile to deliver value faster, not to cut cost first.
AI in agile delivery
AI is the fastest-moving number in agile adoption, jumping from 68% to 84% in a single year. In the 18th State of Agile Report (2025), AI adoption surged from 68% to 84%, the fastest single-year jump the survey has recorded. More than one-quarter of AI users were already experimenting with Agentic AI, systems that act on their own across tools.
Governance has not kept pace.
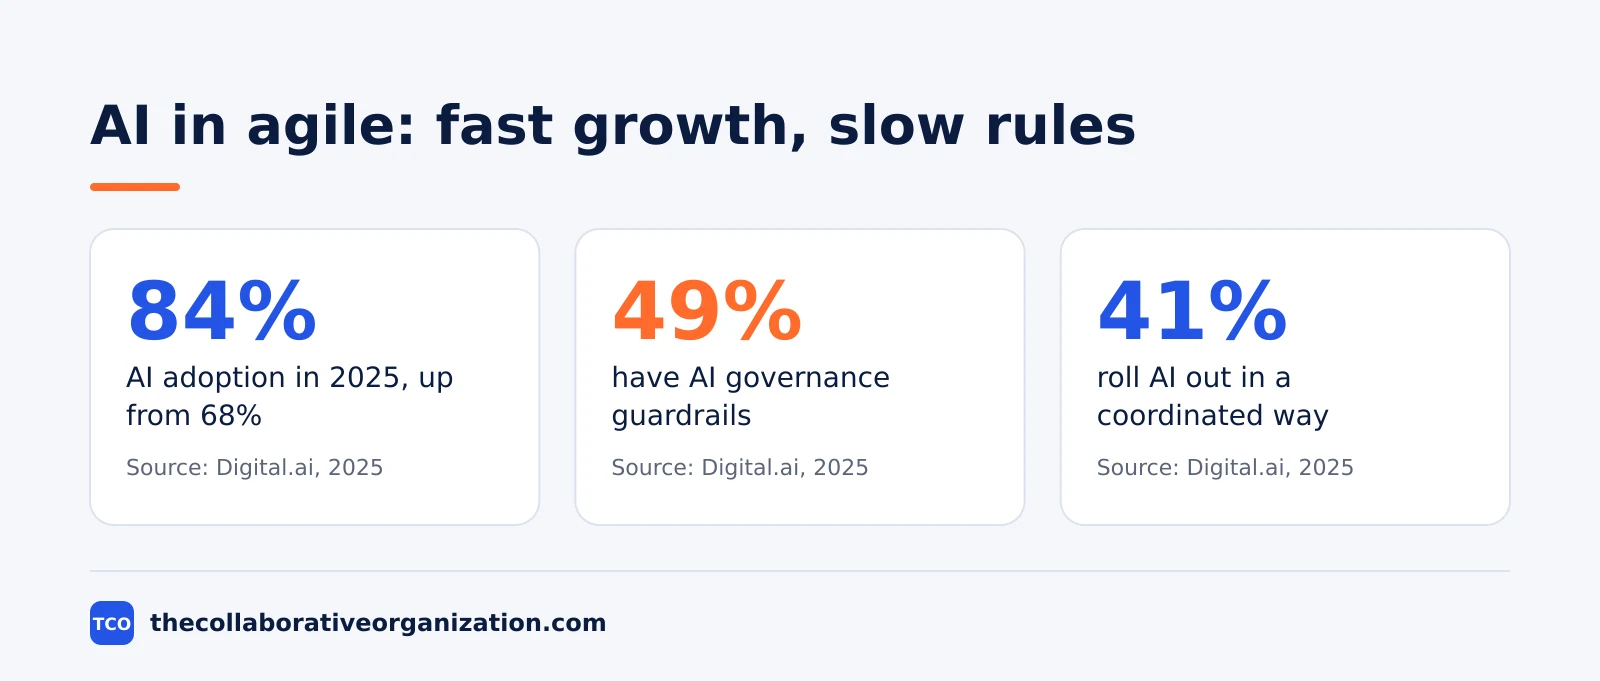
Only 49% of organisations had guardrails in place for AI use, while 41% were implementing AI tools in a coordinated way across teams.
The gap between 84% adoption and 49% governance is 35 percentage points, and it is the largest risk the 2025 report flags. Pressure is rising at the same time: 76% of respondents cited increased scrutiny on the business impact and ROI of agile.
What the numbers mean for results
The numbers point to a gap between adopting agile and getting value from it. Only 27% of people felt their agile culture was enabling them to deliver real value and achieve goals in the 18th report, while 42% said it was better than nothing but could be more effective, 15% said it had become too rigid and process-heavy, and 6% said it was not working for them anymore. That 27% figure is the one to watch: spending is up, but the share who feel enabled is low.
Success measures have shifted toward outcomes.
In the 18th report, customer satisfaction (52%) remained the primary measure of success, followed by efficiency and cost reduction at 40%.
Roles are shifting too: 29% of respondents were now accountable for connecting agile work to business outcomes, and 26% were influencing product and portfolio planning. In the same report, 73% wanted stronger leadership support and clearer alignment between delivery work and business goals.
PMI data adds a useful check.
In Pulse of the Profession 2025, based on 2,841 professionals, projects led by high-business-acumen professionals met business goals on 83% of projects, against 78% for others.
The same split showed 73% on budget against 68%, 63% on schedule against 59%, and a failure rate of 8% against 11%. The lesson is that method choice alone does not decide results; business focus and leadership do.
Setup problems and payoffs
The hardest part of agile adoption is coordination, not the framework itself. In the PwC Luxembourg Agile Survey 2024, 74% of companies named difficulty in coordination as a problem when setting up agile, 70% named a lack of organisational change management, and 57% said managers had difficulty adopting a new leadership style. Loss of efficiency in delivery scored 39%, and friction between employees scored 17%.
The payoffs are real when setup works. In the same PwC survey, [74% of companies named the development of new collaboration modes as a positive outcome](https://plaky.com/learn/project-management/agile-statistics/), 48% named improved overall quality, 39% named increased productivity, and 39% named time savings and improved service delivery.
Reconciliation with clients scored 30%, improved quality of life at work scored 26%, and increased capacity for innovation scored 26%. Kanban users report a similar payoff: in the State of Kanban Report 2022, 50% found Kanban much more effective than other methods and 37% found it more effective, while only 12% found it about the same.
Certifications and the agile workforce
Certification counts show how large the agile workforce has become. Scrum.org counted 1,212,100 Professional Scrum certifications held globally in 2026. The largest share was Professional Scrum Master at 828,999, followed by Professional Scrum Product Owner at 300,830, Professional Scrum Developer at 29,943 and Professional Agile Leadership at 21,263. Smaller counts included Professional Scrum with Kanban at 9,399 and Scaled Professional Scrum at 7,721.
PMI certification shows a career payoff.
Among PMI Agile Certified Practitioners, 86% qualified for new opportunities after getting the certification, and 84% gained recognition for career advancement, according to PMI figures quoted by Plaky. These are self-reported career outcomes, not controlled studies, so treat them as a signal about demand for the credential rather than proof that the credential alone caused the outcome.
The full statistics table
The table below gathers the 50 stats from this article in one place, grouped by theme, with the source and year for each. Use it to check a figure before you quote it, and read the sections above for the sample size and limits behind each number.
| Stat | Source | Year |
|---|---|---|
| 74% use hybrid, blended or homegrown agile | Digital.ai 18th State of Agile | 2025 |
| 13% say agile is deeply embedded | Digital.ai 18th State of Agile | 2025 |
| 25% practise agile inconsistently across departments | Digital.ai 18th State of Agile | 2025 |
| 22% scaled across IT, limited business involvement | Digital.ai 18th State of Agile | 2025 |
| 20% limited to team-level execution | Digital.ai 18th State of Agile | 2025 |
| 41% increased agile spending in past 2 years | Digital.ai 18th State of Agile | 2025 |
| 17% increased spending significantly | Digital.ai 18th State of Agile | 2025 |
| 24% increased spending somewhat | Digital.ai 18th State of Agile | 2025 |
| 84% use AI in agile delivery, up from 68% | Digital.ai 18th State of Agile | 2025 |
| 49% have AI governance guardrails | Digital.ai 18th State of Agile | 2025 |
| 41% implementing AI in a coordinated way | Digital.ai 18th State of Agile | 2025 |
| More than 25% of AI users try Agentic AI | Digital.ai 18th State of Agile | 2025 |
| 76% cite increased ROI scrutiny | Digital.ai 18th State of Agile | 2025 |
| 73% want stronger leadership support | Digital.ai 18th State of Agile | 2025 |
| 52% name customer satisfaction as primary success measure | Digital.ai 18th State of Agile | 2025 |
| 40% name efficiency and cost reduction | Digital.ai 18th State of Agile | 2025 |
| 29% accountable for connecting agile to business outcomes | Digital.ai 18th State of Agile | 2025 |
| 26% influencing product and portfolio planning | Digital.ai 18th State of Agile | 2025 |
| 27% feel agile culture enables real value | Digital.ai 18th State of Agile | 2025 |
| 42% say culture is better than nothing | Digital.ai 18th State of Agile | 2025 |
| 15% say culture is too rigid and process-heavy | Digital.ai 18th State of Agile | 2025 |
| 44% SAFe adoption | Digital.ai 18th State of Agile | 2025 |
| 63% of agile teams use Scrum | Digital.ai 17th State of Agile | 2024 |
| 69% use agile in IT | Digital.ai 17th State of Agile | 2024 |
| 68% use agile in software development | Digital.ai 17th State of Agile | 2024 |
| 48% use agile in engineering, product and R&D | Digital.ai 17th State of Agile | 2024 |
| 28% use agile in business operations | Digital.ai 17th State of Agile | 2024 |
| 22% use agile in customer support | Digital.ai 17th State of Agile | 2024 |
| 19% use agile in marketing | Digital.ai 17th State of Agile | 2024 |
| 17% use agile in HR | Digital.ai 17th State of Agile | 2024 |
| 41% adopt agile for customer and business value | Digital.ai 17th State of Agile | 2024 |
| 41% adopt agile to accelerate time to market | Digital.ai 17th State of Agile | 2024 |
| 34% adopt agile for digital transformation | Digital.ai 17th State of Agile | 2024 |
| 30% adopt agile for delivery predictability | Digital.ai 17th State of Agile | 2024 |
| 74% name coordination difficulty in setup | PwC Luxembourg Agile Survey | 2024 |
| 70% name lack of change management | PwC Luxembourg Agile Survey | 2024 |
| 57% say managers struggle with new leadership style | PwC Luxembourg Agile Survey | 2024 |
| 74% gain new collaboration modes | PwC Luxembourg Agile Survey | 2024 |
| 48% gain improved overall quality | PwC Luxembourg Agile Survey | 2024 |
| 39% gain increased productivity | PwC Luxembourg Agile Survey | 2024 |
| 13% use Kanban in all teams | State of Kanban Report | 2022 |
| 32% use Kanban in 2 to 5 teams | State of Kanban Report | 2022 |
| 50% find Kanban much more effective | State of Kanban Report | 2022 |
| 37% find Kanban more effective | State of Kanban Report | 2022 |
| 87% plan to expand Kanban in the next year | State of Kanban Report | 2022 |
| 1,212,100 Professional Scrum certifications held | Scrum.org | 2026 |
| 828,999 Professional Scrum Master certs | Scrum.org | 2026 |
| 300,830 Professional Scrum Product Owner certs | Scrum.org | 2026 |
| 86% of PMI-ACPs qualified for new opportunities | PMI | 2026 |
| 84% of PMI-ACPs gained career recognition | PMI | 2026 |
| 57% rise in hybrid approaches since 2020 | PMI Pulse of the Profession | 2025 |
| 24% fall in purely predictive approaches | PMI Pulse of the Profession | 2025 |
| 83% vs 78% meet business goals (high vs other acumen) | PMI Pulse of the Profession | 2025 |
| 8% vs 11% project failure rate (high vs other acumen) | PMI Pulse of the Profession | 2025 |
Worked example: reading the numbers for one team
A 40-person product team reads the table above and takes three actions, and the example below shows how the numbers turn into decisions. The team is fictional, and the figures are an illustration of how to use the stats, not a case study. First, the team sees that only 27% of people feel enabled by their agile culture, so it runs a short survey of its own before changing any process. Second, it sees that 84% of organisations use AI but only 49% have guardrails, so it writes a one-page rule for AI use in planning and code review before buying any new AI tool. Third, it sees that 74% of companies struggle with coordination, so it names one person to own cross-team dependencies instead of adding another meeting. The team also reads our agile vs waterfall guide before it changes any process, so it understands when a predictive step still fits.
Common mistakes when quoting agile statistics
The most common mistake is quoting a percentage without its sample, year or definition. A figure from a 350-person survey of large-enterprise coaches does not describe all companies, and a 2022 Kanban figure does not describe 2026. Check the year in the table before you cite a number, and name the source in the same sentence. Our guide to what is agile project management covers the method itself, so this article stays focused on the numbers.
- Mixing different definitions of success. PMI, Digital.ai and PwC each define success differently, so do not place their percentages side by side as if they measured the same thing.
- Quoting a secondary list as the original. Many lists copy Digital.ai or PMI figures without the sample size, so go back to the publisher page linked in each section.
- Treating a small sample as a market share. The 18th State of Agile Report had nearly 350 respondents, mostly from very large enterprises, so its figures are directional signals from senior practitioners.
- Using an old figure as current. The State of Kanban figures are from 2022 and the 17th State of Agile figures are from 2024, so label them with their year every time.
Sources
- Digital.ai - 18th State of Agile Report Press Release (2025)
- Plaky - Agile Statistics: Verified Data on Adoption and Success Rates (2026)
- Pawel Rola - 18th State of Agile Report: 10 Key Insights (2025)
- PM Study Circle - Agile Project Management Statistics and Adoption Rates (2026)
- WorkIntelHub - Project Management Statistics (2026)
- VACT - Agile Adoption in 2026: What the Latest Statistics Tell Us (2026)
- Agile Manifesto - The 4 Values and 12 Principles Explained (2026)
- UC Berkeley Extension - PMI Releases Pulse of the Profession Reports (2026)
Frequently asked questions
How many organisations use agile in 2026?
Most large organisations use some form of agile. In the 18th State of Agile Report (2025), 74% of organisations said they use hybrid, blended or homegrown agile models. Only 13% said agile is deeply embedded across the business, so wide use and deep use are two different things.
Is agile still growing?
Spending says yes, even while satisfaction stays flat. In the 18th State of Agile Report (2025), 41% of organisations increased their agile spending over the past two years. Hybrid approaches rose 57% since 2020 in PMI Pulse of the Profession data, while purely predictive approaches fell 24% over three years.
What is the most used agile framework?
Scrum is the most used agile framework. In the 17th State of Agile Report, 63% of agile teams said they use Scrum. SAFe is the most used scaling framework, with 44% adoption in the 18th State of Agile Report (2025). Kanban is the most used flow method, often mixed with Scrum.
Does agile improve project results?
The evidence is mixed and depends on how success is measured. PMI Pulse of the Profession 2025 found that projects led by high-business-acumen professionals met business goals on 83% of projects, against 78% for others, and failed on 8% against 11%. Method alone did not decide the outcome; leadership and business focus mattered more.
How common is AI in agile teams?
AI is now common in agile delivery. In the 18th State of Agile Report (2025), 84% of respondents said their organisations use AI, up from 68% the year before. Only 49% had governance guardrails in place, and 41% were rolling AI out in a coordinated way across teams.
Why do companies adopt agile?
The top reasons are customer value and speed. In the 17th State of Agile Report, 41% of organisations named prioritising and delivering customer and business value, and 41% named accelerating time to market. Digital transformation followed at 34%, and delivery predictability at 30%.
Related articles
project management
How to Choose Project Management Software (2026)
Pick project management software in seven steps: define the work, count seats, price the real cost, and run a two-week pilot before you pay.
November 19, 2026 · 10 min read
project management
What Is a RACI Matrix? Definition, Roles and Examples (2026)
A RACI matrix maps who is Responsible, Accountable, Consulted and Informed for each task. Learn the four roles, how to build one, and see a worked example.
November 19, 2026 · 9 min read
project management
Daily Standup Meeting Format That Works (2026)
A daily standup is a 15-minute meeting where Developers inspect progress toward the Sprint Goal and plan the next day. Use this format to run one that ends on time.
November 19, 2026 · 10 min read