What Is Velocity in Agile? (2026) | The Collaborative Organization
By The Collaborative Organization Team · November 19, 2026 · Last verified November 19, 2026 · 11 min read

Velocity in agile is the amount of work a team finishes in one sprint, usually counted in story points. A sprint’s velocity is the sum of the points for the stories the team fully completed. Averaged over several sprints, it becomes the team’s most practical planning number.
Key takeaways
- Velocity is the sum of story points for fully completed stories in one sprint; unfinished work counts as zero.
- Average velocity over the last 3 to 6 sprints is the number to plan with, not a single sprint.
- A 200-point backlog at 50 points per sprint takes about 4 more sprints to finish.
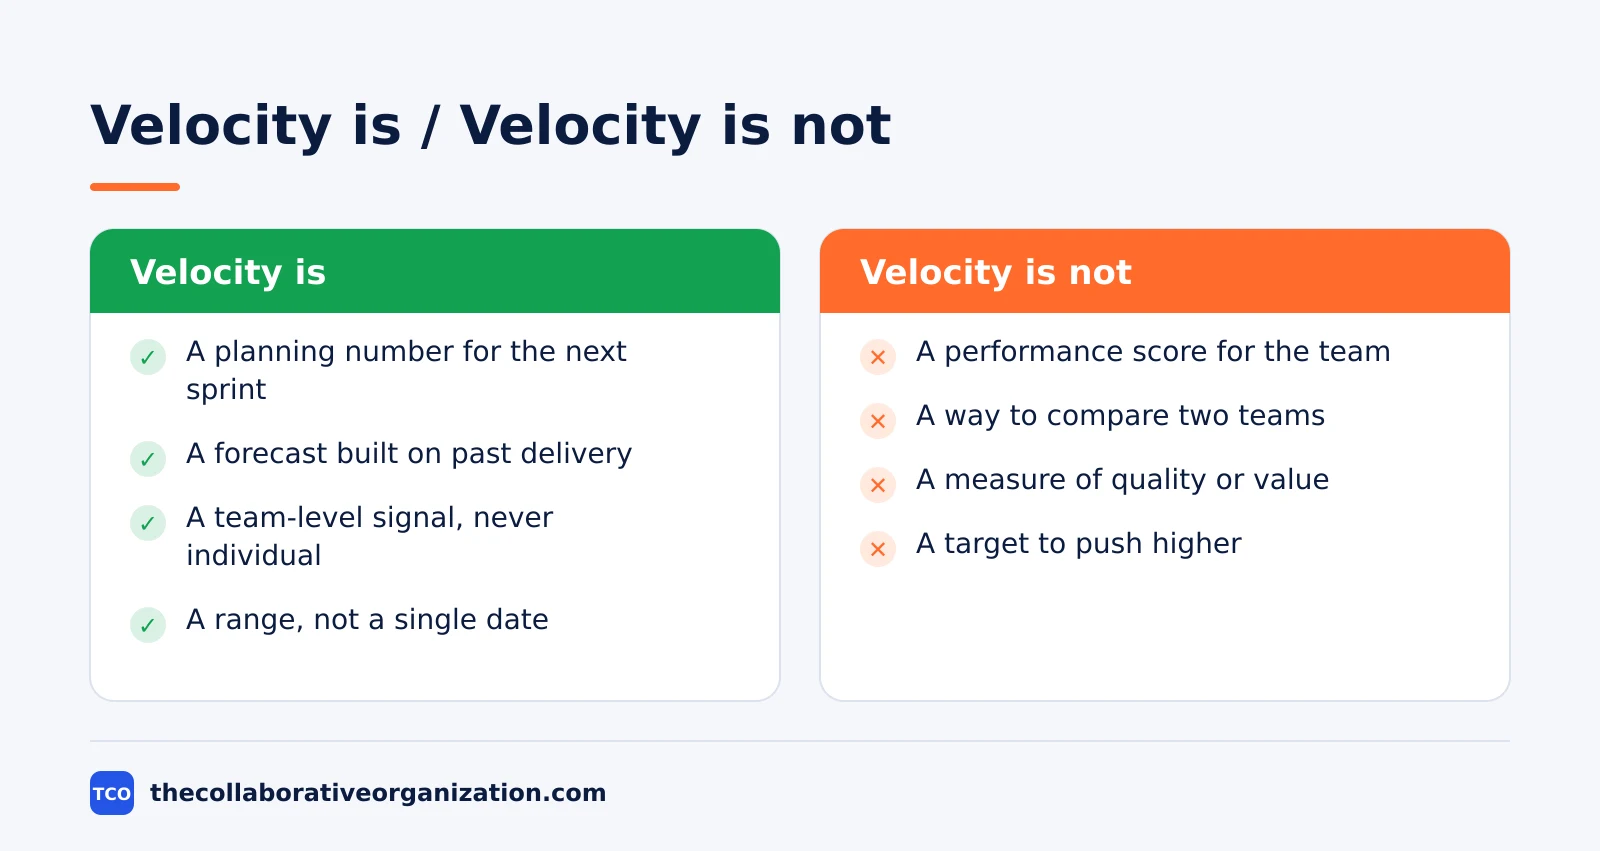
- Velocity is a planning tool, not a performance score, and it cannot be compared across teams.
- New Scrum teams usually average 5 to 10 story points per person per two-week sprint.
- Velocity says nothing about quality, customer value, or team health.
What velocity in agile is
Velocity is a measure of how much work a Scrum team turns into finished, usable work during a single sprint. Scrum.org defines it as an optional, but often used, indication of the amount of Product Backlog turned into an Increment of product during a Sprint, tracked by the Developers for use within the Scrum Team.
The word “optional” matters. The Scrum Guide does not require velocity, and a team can run Scrum without it. But most teams track it, because it turns past delivery into a forecast for the next sprint. Without it, sprint planning is a guess about how much the team can take on.
Velocity is measured in the same unit the team uses to estimate, which is usually story points. Story points measure complexity, risk and uncertainty, not hours, so velocity inherits that meaning: it counts how much estimated work the team finished, not how long anyone worked.
A sprint is the unit of time. Sprints run for one month or less, and they follow each other without gaps, so velocity is a rate: points per sprint. A team on 2-week sprints reports velocity every 2 weeks, and a team on 1-week sprints reports it every week.
How to calculate velocity
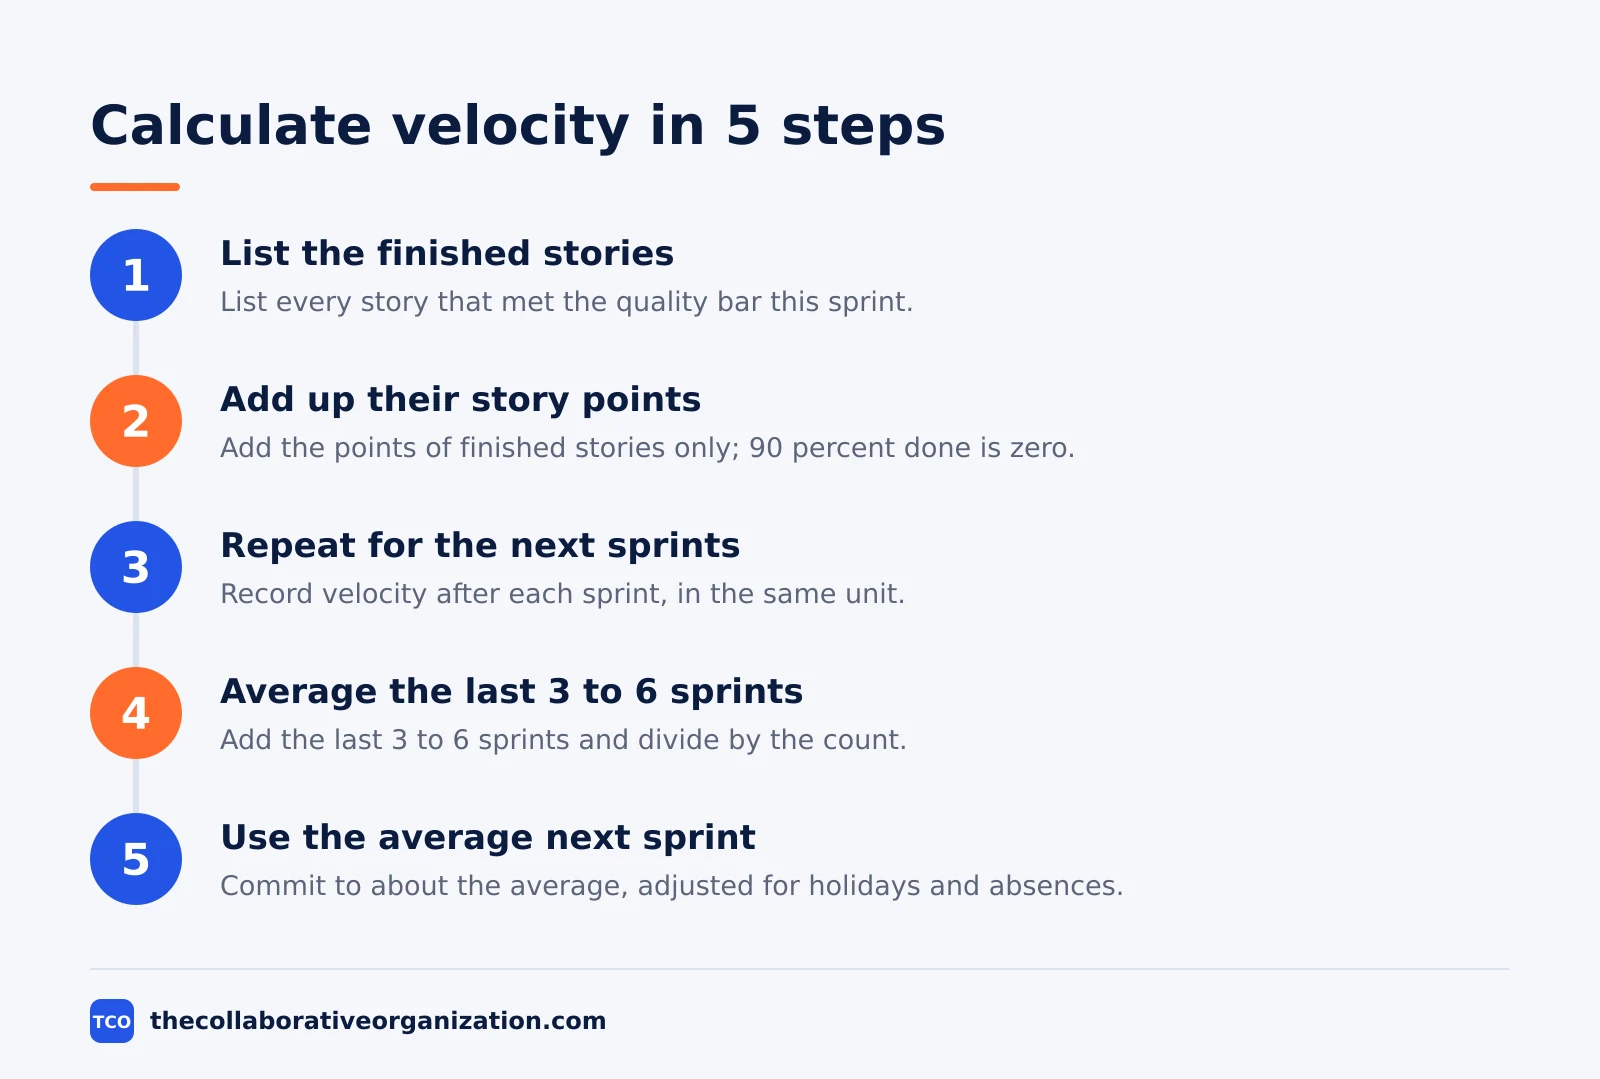
To calculate velocity, add up the story points of every story the team fully completed in the sprint, then average that total over the last 3 to 6 sprints. Only stories that meet the team’s “definition of done” count. A story that is 90 percent done counts as zero, and the team moves it to the next sprint.
Step 1: List the stories the sprint finished
At the end of the sprint, list every story that met its acceptance criteria and the team’s quality bar. Leave out anything still in progress, even if it is nearly done.
Step 2: Add up their story points
Total the points for the finished stories only. That sum is the sprint’s velocity. For example, stories worth 5, 8 and 3 points give a velocity of 16 for that sprint.
Step 3: Repeat for the next sprints
Record the velocity after each sprint, in the same unit, with the same rules. A single sprint is noise: a holiday, a sick day, or one big story can swing the number by half.
Step 4: Average the last 3 to 6 sprints
Add the velocities and divide by the number of sprints. Atlassian gives the example of three sprints at 14, 16 and 15 points: (14 + 16 + 15) / 3 = 15 points average velocity.
Step 5: Use the average for the next sprint
Plan the next sprint around the average, not the best sprint. If the average is 15 points, committing to about 15 points is reasonable, and the team adjusts for holidays or known absences.
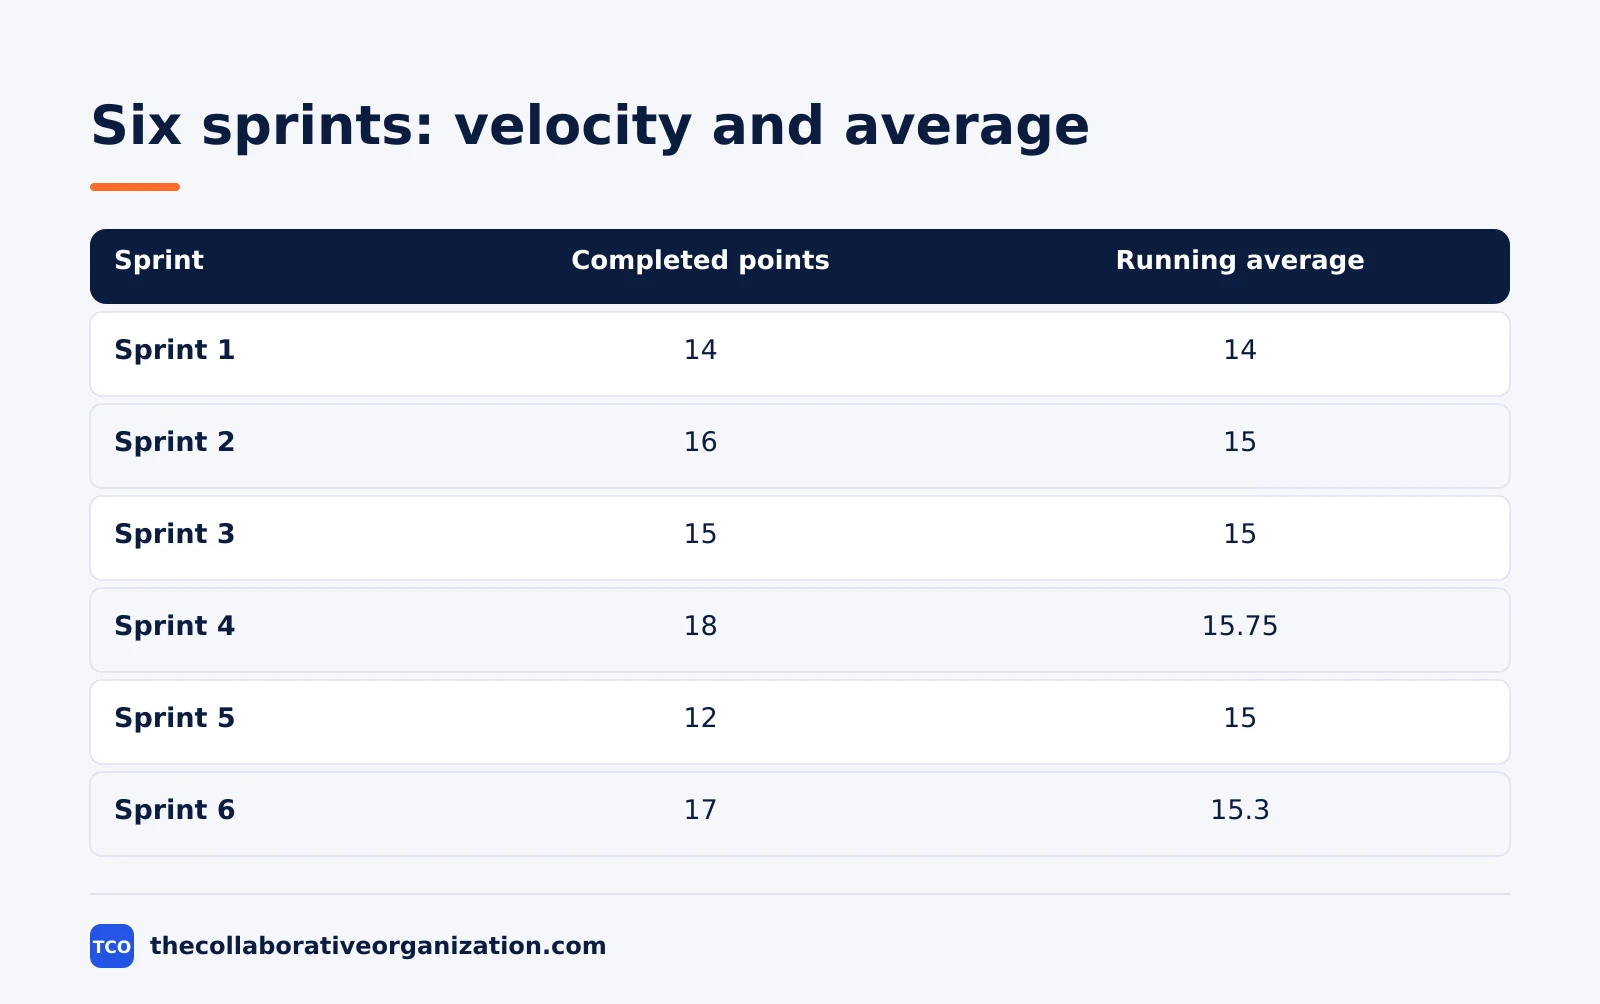
| Sprint | Completed points | Running average |
|---|---|---|
| Sprint 1 | 14 | 14 |
| Sprint 2 | 16 | 15 |
| Sprint 3 | 15 | 15 |
| Sprint 4 | 18 | 15.75 |
| Sprint 5 | 12 | 15 |
| Sprint 6 | 17 | 15.3 |
The table shows why the average matters more than any one sprint. Sprint 4 hit 18 and Sprint 5 fell to 12, but the running average stayed near 15 the whole time. A team that planned from its best sprint would overcommit every other sprint.
Velocity vs throughput vs cycle time
Velocity counts estimated work finished per sprint, throughput counts items finished per sprint, and cycle time counts how long one item takes from start to finish. The three numbers answer different questions, and mixing them up leads to bad plans.
| Metric | What it counts | Unit | Best for |
|---|---|---|---|
| Velocity | Estimated work finished | Story points per sprint | Sprint planning and release forecasts |
| Throughput | Items finished | Stories per sprint | Kanban teams and steady flow |
| Cycle time | Time one item takes | Days from start to done | Spotting slow work and bottlenecks |
Velocity suits Scrum teams that estimate in points and plan in sprints. Throughput suits teams that count items instead of points, such as Kanban teams that pull work through a board. A team that finishes 8 stories per sprint has a throughput of 8, whatever the stories were worth in points.
Cycle time suits questions about speed. If a story takes 9 days from the day work starts to the day it ships, the cycle time is 9 days, even if the sprint is 14 days long. A long cycle time points at waiting, handoffs, or review queues, which velocity cannot see.
Use velocity for planning what fits in a sprint. Use throughput when the team does not estimate in points. Use cycle time when work feels slow even though the team finishes its sprints.
How to use velocity for forecasting
Velocity turns a backlog into a date: divide the remaining points by the average velocity, and the answer is how many sprints the work will take. The forecast is only as good as the average behind it, so it needs 3 to 6 sprints of steady history before it means anything.
Atlassian gives a clean example: if the project backlog has 200 story points and the team’s average velocity is 50 points per sprint, the team will likely need around 4 more sprints to complete the project. The maths is simple, and the honesty comes from the average, not from the division.
Express the forecast as a range, not a single date. If the last 6 sprints ran from 12 to 18 points, say the release takes 11 to 17 sprints, not exactly 14. A range tells stakeholders what the team knows and what it does not, and it survives the first surprise.
Re-forecast every sprint. Each finished sprint adds a new data point, and the average moves. A forecast that never changes is a forecast nobody is reading. Update it at the sprint review, when the backlog and the velocity are both fresh.
Velocity also flags overcommitment early. If the team’s average is 15 and the next sprint holds 30 points, the plan is wrong before the sprint starts. Atlassian notes that a sudden drop to 30 or a jump to 70, against an average of 50, is a red flag worth a conversation.
Worked example: forecasting a release
A team of 5 people with a 180-point backlog shows how velocity turns into a release date. Imagine the team runs 2-week sprints and finished 14, 16, 15, 18, 12 and 17 points over its last 6 sprints. The average is (14 + 16 + 15 + 18 + 12 + 17) / 6 = 15.3 points per sprint.
The backlog holds 180 points of work for the next release. Dividing 180 by 15.3 gives about 12 sprints, which is about 24 weeks at 2 weeks per sprint.
That is the headline forecast, and the team should present it as a range: at 12 points per sprint, the slowest recent pace, the release takes 15 sprints; at 18 points, the fastest, it takes 10 sprints.
Now the team checks the plan. The product owner wants the release in 8 sprints, which would need 22.5 points per sprint, far above anything the team has done. The numbers say the date is not reachable without cutting scope, adding people, or changing what counts as done. That conversation is the point of the forecast.
Two sprints later, the team has finished 16 and 14 points, and the average is still about 15. The backlog has shrunk to 150 points, and the forecast is now 10 more sprints. The release date moved by 2 sprints because 2 sprints passed, not because the team sped up. That is a healthy sign: the forecast is tracking reality.
What affects velocity
Team size, stability, story complexity and outside dependencies move velocity more than effort does. Knowing the four helps the team read a change in the number instead of guessing at it.
Team size and skill set the ceiling. A larger team can finish more points, but more people also add communication overhead and coordination work. A small, skilled team can out-deliver a large team that spends its time in handoffs.
Stability matters as much as size. When the same people work together for several sprints, they learn who is good at what and how to handle problems. New teams usually average 5 to 10 story points per person per two-week sprint, according to Atlassian, and that number steadies as the team settles.
Story complexity swings the number from sprint to sprint. A sprint full of complex stories usually ends with a low velocity, and a sprint of small, clear stories ends high. That is not a change in the team: it is a change in the work.
Outside dependencies and time off cut velocity directly. If the team waits on another team for a database change, or loses a week to public holidays, the points drop. Plan for known absences and dependencies before the sprint starts, instead of explaining the drop after it ends.
Tools that track velocity
Velocity needs a record, and most teams keep it in the same tool that holds the backlog and the sprint board. A velocity chart that plots each sprint’s total next to the running average is enough. Our guide on how to choose project management software covers seat counts and free-plan caps.
If you have not picked a tool yet, compare the options on our project management software shortlist before you set up the board. The right tool is the one that updates the chart when a story moves to done, without manual work.
| Tool | Best for | Free plan | Starting price (as of November 2026) | Notable limit |
|---|---|---|---|---|
| Asana | Teams that track points per task | Free for 2 people | $10.99 per user per month (Starter), billed annually | Free plan covers 2 people |
| monday.com | Teams that want sprint totals on a board | Free plan for up to 2 seats | $9 per seat per month (Basic), billed annually | Paid plans need at least 3 seats |
| ClickUp | Teams that want custom fields for points | Free Forever plan | $9 per user per month (Core), billed annually | Yearly billing needed for that price |
The Asana price comes from Asana pricing: the Personal plan is free for 2 users, and Starter is $10.99 per user per month when billed annually. On the monday.com pricing page, Basic is $9 per seat per month billed annually, with a 3-seat minimum. The ClickUp pricing page lists Core at $9 per user per month billed yearly.
Mountain Goat Software advises teams to keep velocity for forecasting, not for performance review. A chart the team trusts is worth more than a chart a manager watches.
Common velocity mistakes to avoid
Most velocity problems come from treating the number as a target, a score, or a way to compare teams. The five mistakes below cause most of the damage, and all five are easy to spot in a review.
- Using velocity as a performance target. When the number becomes a target, teams inflate estimates to hit it. Mountain Goat Software advises leaders to ask what is preventing the team from delivering valuable work predictably, instead of asking how to increase velocity.
- Comparing teams by velocity. A 5 for one team is not a 5 for another, because each team picks its own baselines. Comparing totals measures nothing real.
- Planning from the best sprint. One great sprint is not the team’s pace. Plan from the average of the last 3 to 6 sprints, and express capacity as a range.
- Counting unfinished work. A story that is 90 percent done counts as zero. Partial credit inflates velocity and hides the real gap between the plan and the result.
- Re-estimating finished stories. Changing the points after the work is done makes the history dishonest. Leave the original estimate alone and talk about the gap in the retrospective.
Sources
- Atlassian - Sprint Velocity in Scrum (2026)
- Scrum.org - Scrum Glossary (2026)
- Mountain Goat Software - Introducing Story Points to a Team (2026)
- Atlassian - Scrum Poker for Agile Projects (2026)
- Asana - Pricing (2026)
- monday.com - Pricing (2026)
- ClickUp - Pricing (2026)
Frequently asked questions
What is a good velocity for a Scrum team?
There is no good number, because velocity is relative to each team. Atlassian notes that new Scrum teams usually average 5 to 10 story points per person per two-week sprint. What matters is whether the number is steady over several sprints, since a steady velocity makes forecasts honest.
How many sprints do you need to measure velocity?
One sprint is noise, and 3 to 6 sprints start to show a stable trend. Use a rolling average of the last 3 to 6 sprints for planning, and express capacity as a range rather than a single number. A team that just changed size or scope needs a fresh run of sprints before its velocity means anything.
Does a story that is 90 percent done count toward velocity?
No. Only stories that fully meet the team's quality bar count, and a story that is 90 percent done counts as zero. Atlassian says the team should move it to the next sprint and re-evaluate the points based on the remaining tasks. Partial credit inflates velocity and hides real progress.
Can you compare velocity between two teams?
No. Story points only mean something next to the same team's own past work, because each team picks its own baselines and scale. A team finishing 40 points a sprint is not slower than a team finishing 60, since their points measure different things. Comparing them pushes teams to inflate their estimates.
Is velocity the same as productivity?
No. Velocity measures how much estimated work a team finished in a sprint, and it says nothing about quality, customer value, or team health. Atlassian is clear that velocity does not measure the quality of work or the delivered business value. A team can finish many points and still ship the wrong thing.
Related articles

project management
What Is a RACI Matrix? Definition, Roles and Examples (2026)
A RACI matrix maps who is Responsible, Accountable, Consulted and Informed for each task. Learn the four roles, how to build one, and see a worked example.
November 19, 2026 · 9 min read
project management
Daily Standup Meeting Format That Works (2026)
A daily standup is a 15-minute meeting where Developers inspect progress toward the Sprint Goal and plan the next day. Use this format to run one that ends on time.
November 19, 2026 · 10 min read
project management
How to Run a Sprint Planning Meeting (2026)
Sprint planning opens every sprint with a goal, a set of backlog items and a plan. Follow these 6 steps to run the meeting in 90 minutes for a two-week sprint.
November 19, 2026 · 9 min read