What Is a Burndown Chart? (2026) | The Collaborative Organization
By The Collaborative Organization Team · November 19, 2026 · Last verified November 19, 2026 · 12 min read
A burndown chart is a graph that plots remaining work against time, so a team can see at a glance whether a sprint will finish on plan. The horizontal axis shows time, the vertical axis shows work left, and two lines, one ideal and one actual, run from the full scope down toward zero.
Key takeaways
- A burndown chart plots remaining work on the vertical axis against time on the horizontal axis.
- The ideal line runs straight from the total scope to zero; the actual line shows real progress each day.
- A flat actual line means stalled work, and a line above the ideal line means the team is behind pace.
- Sprint, release, project and product burndowns answer different questions about time and scope.
- A burndown chart is not required by Scrum, and it hides scope changes unless the team tracks them separately.
- Update the chart every day, usually at the daily standup, so it can warn the team in time to act.
What a burndown chart is
A burndown chart is a visual tracker that shows how much work remains in a sprint versus how much time is left. Scrum.org defines it as a chart which shows the amount of work which is thought to remain in a backlog, with time on the horizontal axis and work remaining on the vertical axis. As items are completed, the line showing work remaining is expected to fall.
It is called a burndown chart because the work “burns down” to zero on or before the last day of the sprint. Lucid puts it plainly: two lines, one showing an ideal rate of progress and another showing actual progress, start at the same point and move downward over time. When the actual line reaches zero, the sprint is done.
The chart answers one question: how much work is left, and is that number shrinking fast enough? It does not say which tasks are left, who is doing them, or whether the team picked the right work. It is a progress signal, not a plan.
The chart is optional in Scrum. The 2020 Scrum Guide does not mandate it: it requires the team to track progress toward the Sprint Goal and leaves the format to the team. Burndown charts are the most used format because they make delivery risk visible at a glance, not buried in a status update.
The parts of a burndown chart
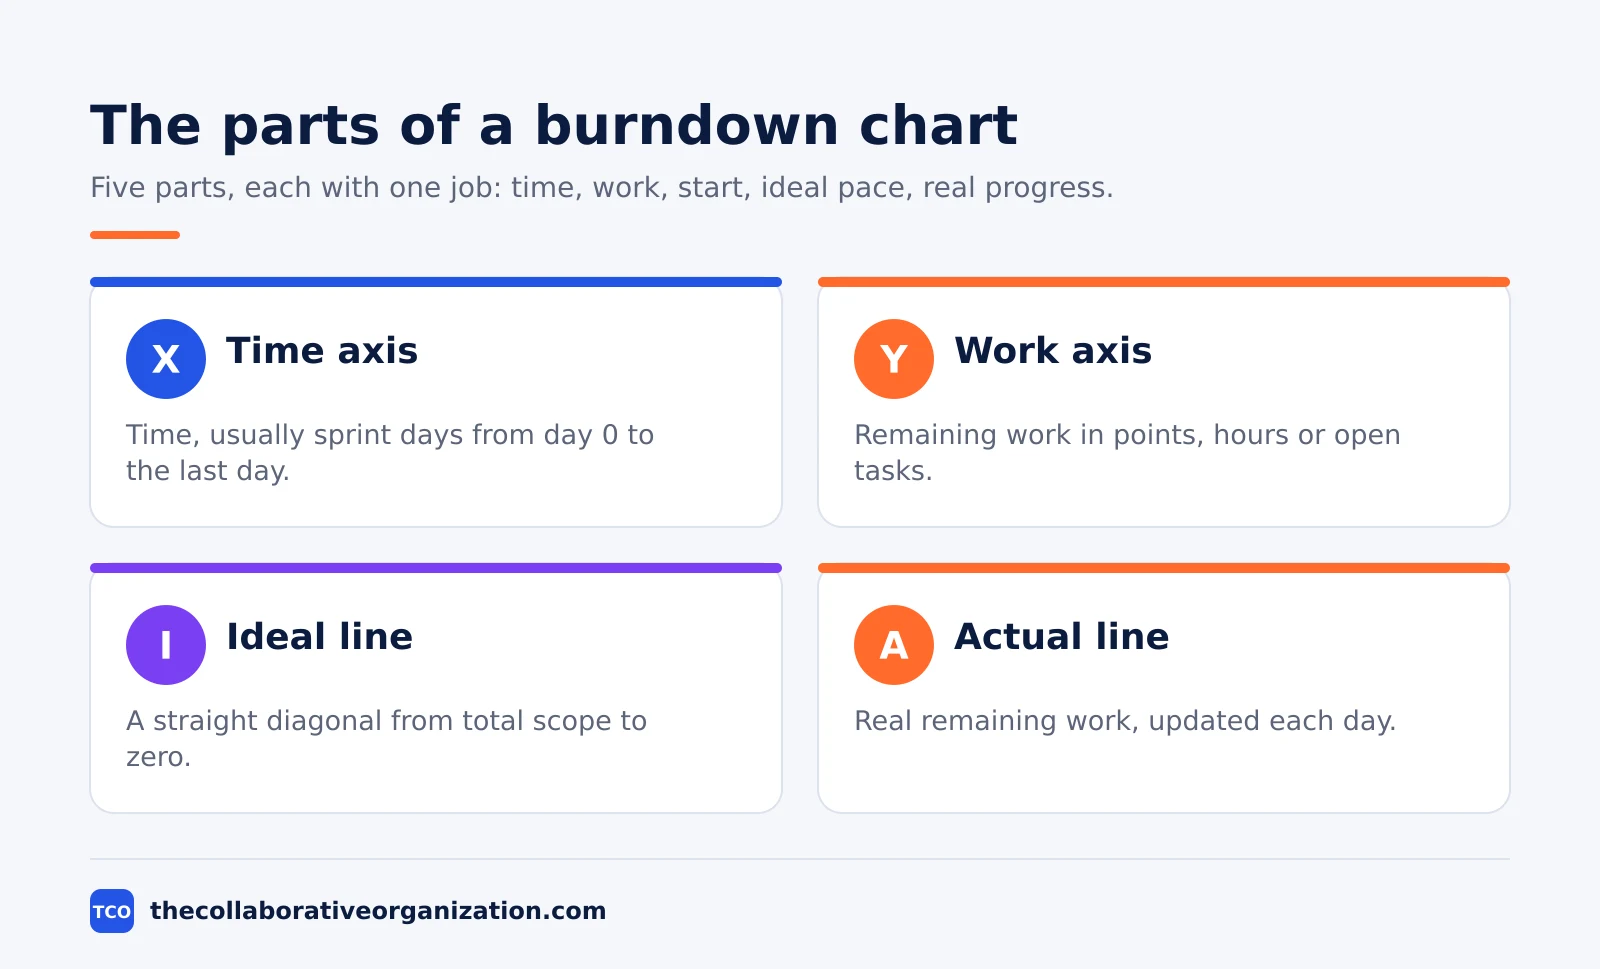
Every burndown chart has five parts: a time axis, a work axis, a starting point, an ideal line, and an actual line. Each part has one job, and a chart missing any of them is hard to read.
| Part | What it shows |
|---|---|
| X-axis | Time, usually sprint days from day 0 to the last day |
| Y-axis | Remaining work, usually story points, hours or open tasks |
| Starting point | Total scope at day 0, at the top of the Y-axis |
| Ideal line | A straight diagonal from total scope to zero by the last day |
| Actual line | Real remaining work, updated each day |
The X-axis shows time, and the Y-axis shows the work still to do. The starting point sits at the top left, where all the work remains and no time has passed.
The ideal line runs straight from that point to zero on the last day: it is the pace the team would need if it finished an equal share of work every day.
The actual line is the honest one. It plots the real remaining work at the end of each day, so it moves up, down, or flat as the sprint goes. Asana notes that if the actual line rises, flattens, or diverges from the ideal line, blockers, scope changes, or workload issues may be affecting delivery.
The unit on the Y-axis matters. Most teams use story points, since points are the unit the team already estimates in. Some teams use hours or a count of open tasks instead. Pick one unit for the whole sprint and do not switch it halfway, or the line will jump for no real reason.
Sprint burndown vs release burndown
A sprint burndown tracks one sprint day by day, while a release burndown tracks a whole release across several sprints. The two charts answer different questions, and a team that confuses them reads the wrong signal.
| Chart | Time span | What it answers |
|---|---|---|
| Sprint burndown | One sprint, day by day | Is this sprint on track to finish? |
| Release burndown | Several sprints | Will the release land on its date? |
| Project burndown | A whole project | Is the project on track overall? |
| Product burndown | A backlog or large epic | How much of the epic is left? |
A sprint burndown is the daily tool. It shows whether the team is on pace to meet its sprint goal and helps it adjust quickly when work, priorities, or deadlines change. The team itself is the audience, and the chart is read at the daily standup.
A release burndown zooms out. It plots remaining backlog items across multiple sprints, so stakeholders can see whether a release date holds. A product burndown, also called an epic burndown, zooms out further: it tracks a whole backlog or a large epic over months.
Asana lists four types: sprint, release, project and product burndown charts. The sprint chart is the one most teams draw first, because it is the smallest and the most useful day to day. Start there, and add a release chart only when a date spans several sprints.
How to read a burndown chart
To read a burndown chart, compare the actual line with the ideal line, then ask what caused the gap. The chart starts a conversation; it does not deliver a verdict. Four patterns cover most of what a team will see.
First, the actual line sits below the ideal line. The team is ahead of pace, because it finished more work than the steady rate assumed. Check whether the team really finished early, or whether the estimates were generous. Either way, the sprint is safe.
Second, the actual line sits above the ideal line. The team is behind pace, because less work is done than the plan assumed. Look for a blocker, a story that grew, or work that was added mid-sprint. The gap is a warning, not a failure: it is early enough to act on.
Third, the line goes flat for a day or more. Nothing finished, which usually means stalled work. A story may be blocked, waiting on review, or larger than it looked. Asana notes that a flat line can indicate stalled work, while a steep drop can show a surge in productivity or a milestone reached.
Fourth, the line jumps up. Remaining work grew, which means scope was added or an estimate was raised. The chart itself does not show the cause: it only shows the jump. Pair the chart with the backlog to see what changed, since added work does not appear on the chart as a separate line.
How to build a burndown chart in 5 steps
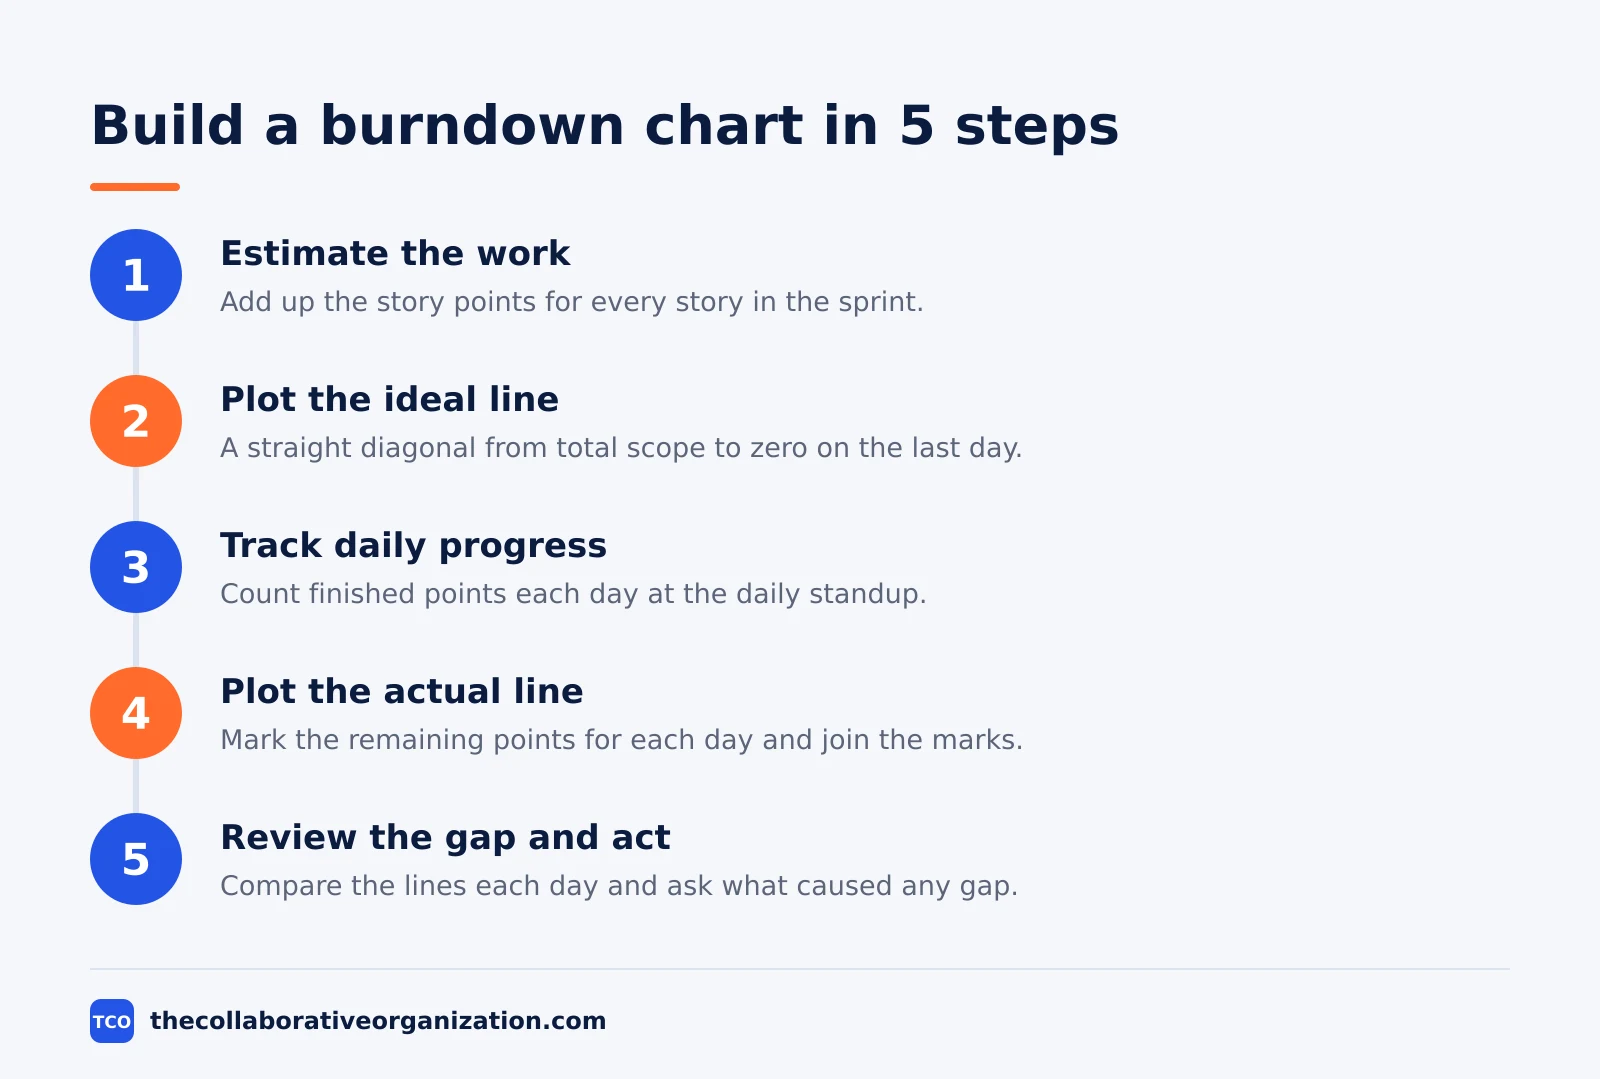
Building a burndown chart takes five steps, and the first two are counting, not drawing. The steps below follow the method Asana describes, and they work on paper, in a spreadsheet, or in a project tool.
Step 1: Estimate the work
Add up the story points for every story in the sprint. The outcome is the starting point on the Y-axis: the total scope on day 0. For example, a sprint with 50 points starts at 50.
Step 2: Plot the ideal line
Draw a straight diagonal from the starting point to zero on the last day. The outcome is the pace the team needs: 50 points over 10 days means 5 points per day. Asana gives a similar example with hours: 80 hours over 5 days means 16 hours of work per day.
Step 3: Track daily progress
At the end of each day, count the points of stories that fully meet the team’s quality bar. The outcome is one new point on the actual line per day. Update the chart at the daily standup, while the board is fresh.
Step 4: Plot the actual line
Mark the remaining points for each day and join the marks. The outcome is a line that moves with real progress: down when stories finish, flat when nothing finishes, and up when scope is added.
Step 5: Review the gap and act
Compare the two lines each day and ask what caused any gap. The outcome is an early decision: remove a story, unblock a task, or warn stakeholders. A chart nobody reads is decoration.
Worked example: a 10-day sprint with 50 points
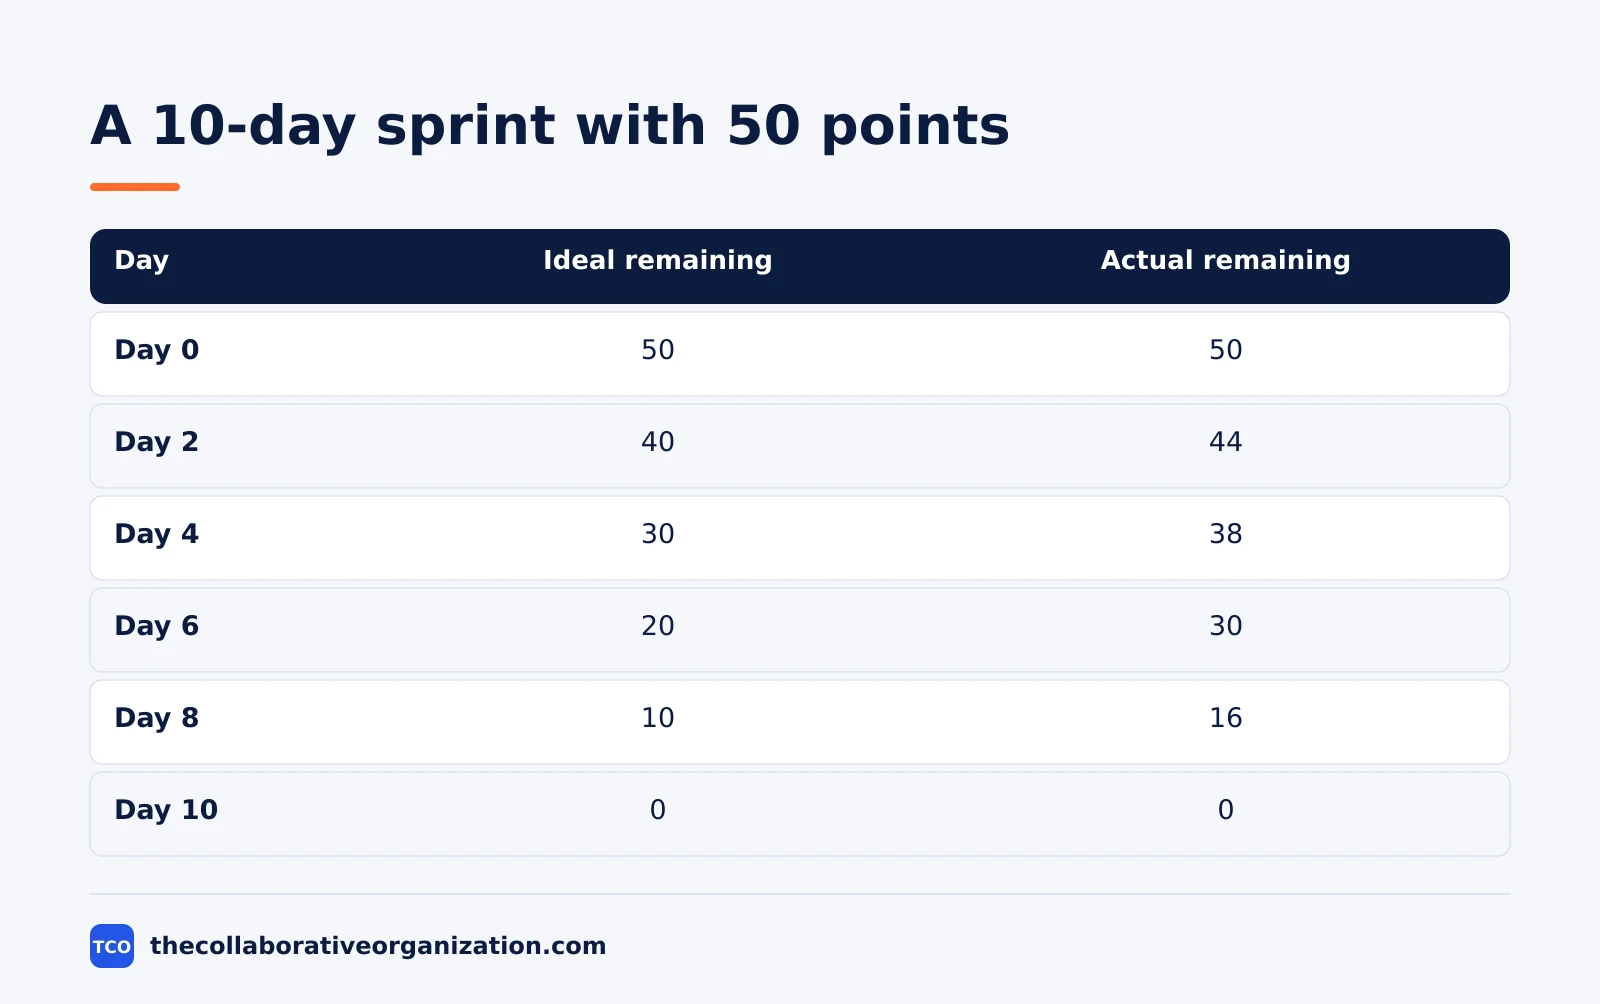
A team of 4 people running a 10-day sprint with 50 story points shows how the two lines behave. Imagine the sprint starts on a Monday with 50 points of work. The ideal line falls by 5 points a day, reaching zero on day 10.
| Day | Ideal remaining | Actual remaining |
|---|---|---|
| Day 0 | 50 | 50 |
| Day 1 | 45 | 47 |
| Day 2 | 40 | 44 |
| Day 3 | 35 | 44 |
| Day 4 | 30 | 38 |
| Day 5 | 25 | 33 |
| Day 6 | 20 | 30 |
| Day 7 | 15 | 24 |
| Day 8 | 10 | 16 |
| Day 9 | 5 | 8 |
| Day 10 | 0 | 0 |
Three things stand out. On day 3 the actual line goes flat at 44: nothing finished that day, because a story was blocked waiting on a design review. On day 4 the team unblocks it and finishes 6 points, the best day so far.
By day 8 the actual line is still 6 points above the ideal line, so the team cuts one 5-point story from the sprint and moves it to the next one. The day 8 drop of 8 points is 3 points finished plus the 5-point story cut, and the line reaches zero on day 10.
The lesson is the point of the chart: the flat line on day 3 warned the team a week before the deadline, and the cut on day 8 was a choice, not a surprise. A chart read daily gives the team time to act.
Burndown vs burnup
A burndown chart counts down to zero, while a burnup chart counts up toward the total scope. Both show progress, but they show different things, and the burnup fixes the burndown’s biggest blind spot.
A burnup chart has two lines that rise: one for completed work, and one for total scope. As the team finishes work, the completed line climbs toward the scope line. When the two lines meet, the work is done.
Lucid notes that burnup charts start at zero, while burndown charts move towards zero, and that burndown charts presume a deadline in a way burnup charts do not.
The burnup wins when scope changes. If the product owner adds 10 points mid-sprint, the scope line on a burnup chart jumps up and the change is visible. On a burndown chart, the same change is absorbed into the Y-axis: the actual line jumps up, but nothing says whether the team slowed down or the scope grew.
The burndown wins when the deadline is fixed. A sprint has a last day, and the chart shows at a glance whether the team will reach zero by then. Use a burndown for a sprint with a fixed end, and a burnup for a release where the scope moves and the date is the question.
Tools that draw burndown charts
A burndown chart is easiest when the tool draws it from the board, so the line updates as stories move to done. A spreadsheet works for a first chart, but a project tool keeps the chart next to the work it describes. Our guide on how to choose project management software covers seat counts and free-plan caps.
If you have not picked a tool yet, compare the options on our project management software shortlist before you set up the board. The right tool is the one that updates the chart when a story moves to done, without manual work.
| Tool | Best for | Free plan | Starting price (as of November 2026) | Notable limit |
|---|---|---|---|---|
| Asana | Teams that track remaining work per task | Free for 2 people | $10.99 per user per month (Starter), billed annually | Free plan covers 2 people |
| monday.com | Teams that want progress on a visual board | Free plan for up to 2 seats | $9 per seat per month (Basic), billed annually | Paid plans need at least 3 seats |
| ClickUp | Teams that want sprint charts and custom fields | Free Forever plan | $9 per user per month (Core), billed annually | Yearly billing needed for that price |
The Asana price comes from Asana pricing: the Personal plan is free for 2 users, and Starter is $10.99 per user per month when billed annually. On the monday.com pricing page, Basic is $9 per seat per month billed annually, with a 3-seat minimum. The ClickUp pricing page lists Core at $9 per user per month billed yearly.
A tool that draws the chart for you still needs a human to read it. The chart shows the gap; the team still has to ask what caused it and decide what to do.
Common burndown chart mistakes to avoid
Most burndown charts fail because they are read as a verdict, updated too rarely, or trusted to show scope changes they cannot show. The five mistakes below cause most of the damage.
- Updating the chart once a week. A weekly chart cannot warn the team in time to act. Update it every day, usually at the daily standup, so the line shows real progress.
- Reading the chart as a grade. The chart starts a conversation about blockers and scope; it does not judge the team. A line above the ideal line is a signal to act, not a failure to report.
- Trusting the chart to show scope changes. Added or removed work does not appear as a separate line, which can conceal scope creep. Pair the chart with the backlog to see what changed.
- Switching units mid-sprint. Moving from points to hours halfway through makes the line jump for no real reason. Pick one unit for the whole sprint and keep it.
- Ignoring a flat line. A flat line for a day or more usually means stalled work, not a slow day. Check the board for a blocker before the sprint runs out of days.
Sources
- Scrum.org - Scrum Glossary (2026)
- Asana - How to Use a Burndown Chart (2026)
- Lucid - How to Create a Burndown Chart (2026)
- Atlassian - Sprint Velocity in Scrum (2026)
- Asana - Pricing (2026)
- monday.com - Pricing (2026)
- ClickUp - Pricing (2026)
Frequently asked questions
What is the difference between a burndown chart and a burnup chart?
A burndown chart plots remaining work falling toward zero, while a burnup chart plots completed work rising toward the total scope. Scrum.org defines the burndown as work thought to remain in a backlog, and the burnup as work already completed. A burnup shows scope changes clearly, while a burndown can hide them.
Is a burndown chart required in Scrum?
No. The Scrum Guide does not require a burndown chart, and it gives the practice only one sentence about forecasting progress. Lucid notes that a burndown chart is an optional addition to a more formal Scrum process. The Guide requires the team to track progress toward the Sprint Goal, and the team picks the format.
How often should you update a burndown chart?
Update it every day, usually at the daily standup, so the line shows real progress and not a weekly guess. A chart updated once a week cannot warn the team in time to act. The update takes a minute when the board already shows which stories are done.
What does a flat line on a burndown chart mean?
A flat line means no work was finished since the last update, which usually points to stalled work, a blocker, or a story that is bigger than it looked. Asana notes that a flat line can indicate stalled work, while a steep drop can show a surge in productivity or a milestone reached. Check the board before assuming the team is idle.
What unit goes on the vertical axis of a burndown chart?
Most teams use story points, and some use hours or the count of open tasks. Scrum.org says the amount of work may be assessed in several ways, such as user story points or task hours. Pick one unit for the whole sprint and do not switch it halfway through.
Related articles

project management
What Is a RACI Matrix? Definition, Roles and Examples (2026)
A RACI matrix maps who is Responsible, Accountable, Consulted and Informed for each task. Learn the four roles, how to build one, and see a worked example.
November 19, 2026 · 9 min read
project management
Daily Standup Meeting Format That Works (2026)
A daily standup is a 15-minute meeting where Developers inspect progress toward the Sprint Goal and plan the next day. Use this format to run one that ends on time.
November 19, 2026 · 10 min read

project management
How to Run a Sprint Planning Meeting (2026)
Sprint planning opens every sprint with a goal, a set of backlog items and a plan. Follow these 6 steps to run the meeting in 90 minutes for a two-week sprint.
November 19, 2026 · 9 min read