Burndown vs Burnup Chart: Key Differences (2026) | The Collaborative Organization
By The Collaborative Organization Team · November 19, 2026 · Last verified November 19, 2026 · 13 min read
A burndown chart tracks work remaining down to zero, while a burnup chart tracks completed work up toward total scope. That one difference decides which chart to use: pick the burndown when scope is fixed and the deadline matters, and pick the burnup when scope may move and stakeholders need to see it move.
Key takeaways
- A burndown chart plots one line of work remaining that falls toward zero by the end date.
- A burnup chart plots two lines: completed work rising from zero, and total scope as a separate line.
- A burndown chart hides scope changes, because added work looks the same as slow progress.
- A burnup chart makes scope changes visible, because the scope line steps up when work is added.
- The Scrum Guide names burn-downs and burn-ups as ways to forecast progress, but neither replaces inspection of the work itself.
- Use a burndown chart for a fixed-scope sprint, and a burnup chart for a release where scope may change.
What is a burndown chart?
A burndown chart is a graph that shows how much work remains in a sprint or project over time. Time runs along the x-axis, usually in days, and work remaining runs up the y-axis, usually in story points or task count. The chart starts at the total work on day one and trends down to zero.
Lucid describes the two lines every burndown chart carries: an ideal line and an actual line. The ideal line is a straight diagonal from the starting total down to zero on the last day. It shows the even pace the team needs to finish exactly on time.
The actual line plots the real work remaining each day. It moves above the ideal line when the team is behind, and below it when the team is ahead. Most actual lines zigzag, because work rarely finishes at a steady rate.
A burndown chart suits a finite, fixed timeline. When the end date is set and the scope is agreed, the chart answers one question at a glance: are we on track to finish on time.
What is a burnup chart?
A burnup chart is a graph that tracks completed work and total scope over time, with two separate lines. The completed-work line starts at zero and rises as the team finishes items. The scope line sits above it as the target, and the work is done when the two lines meet.
Lucid explains that a burnup chart uses the scope line as a benchmark for measuring progress. As the team makes progress, the completed-work line reflects how much work is finished at each milestone. The total-work line stands in for the project scope.
The key point is that scope has its own line. When stakeholders add work mid-release, the scope line steps up, and the completed line keeps its own story. Nobody has to guess whether a flat stretch means slow work or a bigger target.
Burnup charts suit open-ended work and releases where scope may shift. They track elapsed time instead of counting down to zero, so they fit projects with flexible timelines, many dependencies, or a complex scope.
Burndown vs burnup chart: side-by-side comparison
The core difference is scope: a burndown chart folds scope into one line, while a burnup chart gives scope its own line. Everything else follows from that choice, as the table below shows.
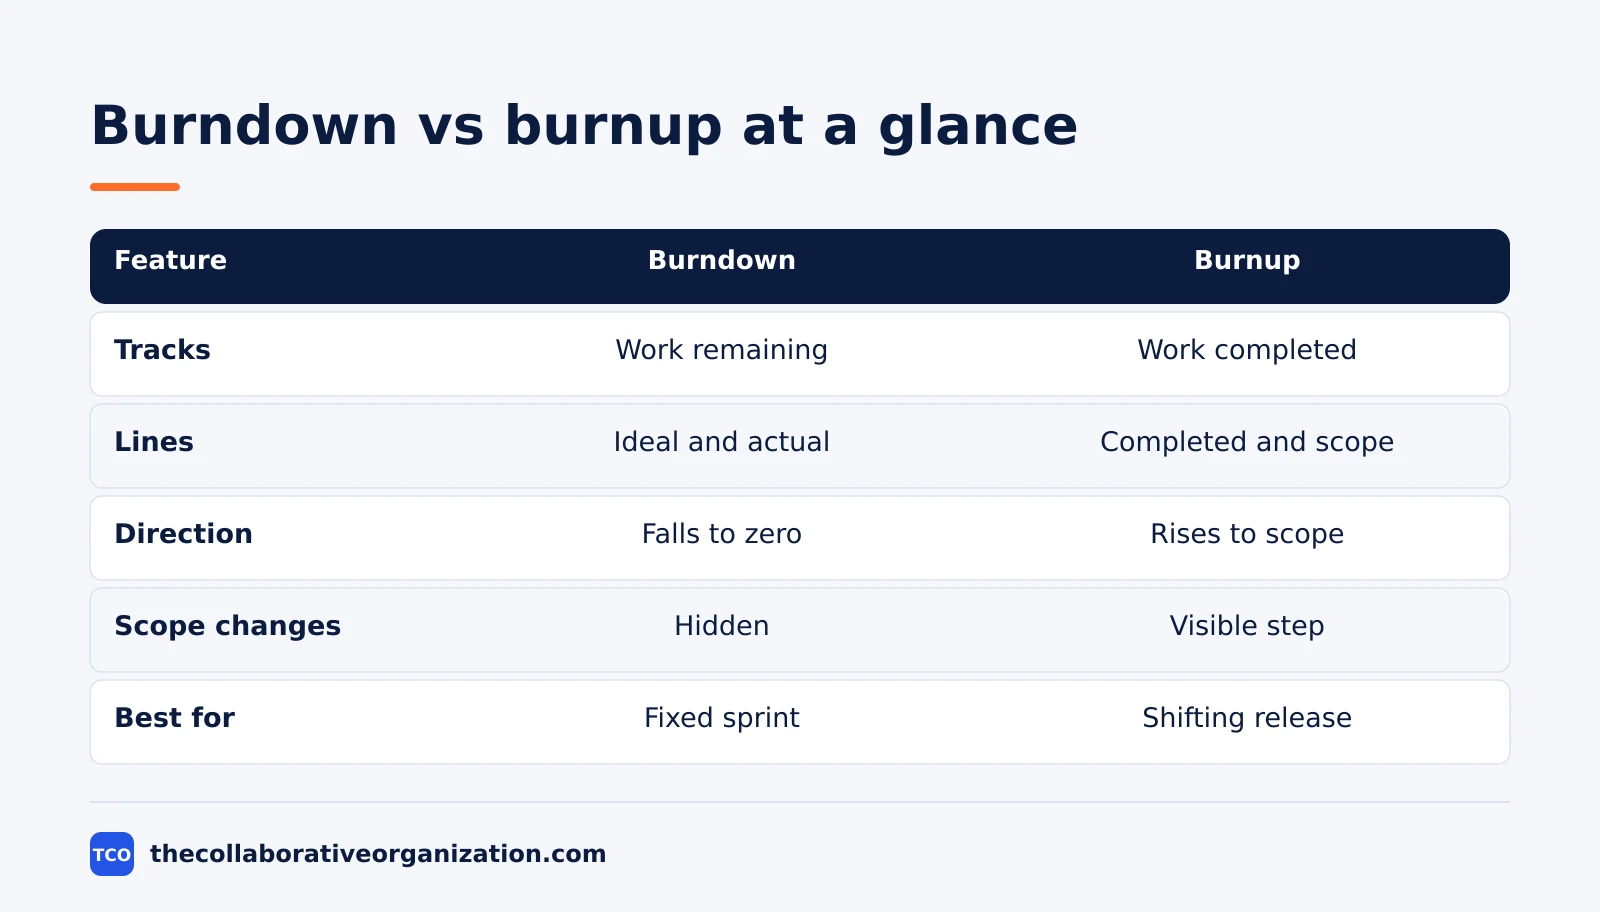
| Feature | Burndown chart | Burnup chart |
|---|---|---|
| What it tracks | Work remaining | Work completed, plus total scope |
| Lines | 2: ideal and actual remaining | 2: completed work and total scope |
| Direction | Falls toward zero | Rises toward the scope line |
| Start point | Total work on day one | Zero completed work |
| Scope changes | Hidden in the single line | Visible as a step in the scope line |
| Deadline focus | Strong, it counts down to a date | Weak, it tracks elapsed time |
| Best for | Fixed-scope sprints | Releases with shifting scope |
| Reading it | Gap to zero is work left | Gap between lines is work left |
Microsoft puts the same point in one sentence for its Azure DevOps widgets: burndown charts focus on remaining work, and burnup charts focus on completed work. Both help a team judge whether it is on track to finish by the end date.
How to read a burndown chart
Read a burndown chart by comparing the actual line with the ideal line, then checking the gap to zero. The chart has five parts, and each one answers a different question.
First, check the axes. The x-axis shows the timeline in days, weeks, or sprints, and the y-axis shows work remaining. The starting point sits at the top left, at the total work on day zero.
Next, follow the ideal line. It runs straight from the start to zero on the last day, and it shows the pace needed to finish on time. Then follow the actual line. Points below the ideal line mean the team is ahead, and points above it mean the team is behind.
Watch the shape of the actual line. A flat stretch means little work finished in that period, and a steep drop means a large batch finished at once. A line that rises means work was added, or work thought done came back.
Finally, project the trend. If the actual line keeps its current slope, extend it to the x-axis to see the likely finish date. If that date falls after the deadline, the team must cut scope, add help, or move the date.
How to read a burnup chart
Read a burnup chart by watching three things: the completed line, the scope line, and the gap between them. The gap is the work still to do, and the scope line explains why that gap changes.
Start with the completed line. It rises from zero as work finishes, so a steep rise means a strong period, and a flat stretch means little finished. Then look at the scope line. A flat scope line means the target held still, and a step up means new work was added.
Next, measure the gap between the two lines. A shrinking gap means the team is closing on the target, even if the target moved. A growing gap means scope grew faster than delivery, which is a different problem from slow work.
Microsoft notes that its burnup widget can show total scope increase over time, and a projected completion date based on remaining work, past burn rate, and scope growth. That projection is the number to raise with stakeholders when the finish date starts to slip.
The 2020 Scrum Guide lists burn-downs and burn-ups side by side as practices that forecast progress. Neither chart replaces inspection, but both give the team numbers to inspect.
Burndown vs burnup chart example: a 10-day sprint
A 10-day sprint with 50 story points shows how the two charts tell different stories from the same work. Imagine a team of four developers building a checkout update. The sprint starts with 50 points, and on day 6 stakeholders add 10 points of payment work, so scope rises to 60.
The table below tracks the sprint day by day. The burndown column shows work remaining, and the burnup columns show completed work and total scope separately.
| Day | Remaining (burndown) | Completed (burnup) | Total scope (burnup) |
|---|---|---|---|
| 0 | 50 | 0 | 50 |
| 2 | 42 | 8 | 50 |
| 4 | 30 | 20 | 50 |
| 6 | 32 | 28 | 60 |
| 8 | 18 | 42 | 60 |
| 10 | 0 | 60 | 60 |
Read the burndown first. On day 6 the remaining work rises from 30 to 32, even though the team finished 8 more points. A reader who only sees the burndown might conclude the team stalled, when in fact scope grew by 10 points.
Now read the burnup. The completed line climbs steadily from 0 to 60, and the scope line steps from 50 to 60 on day 6. The gap between the lines shrinks every two days, and it closes on day 10. The story is clear: the team delivered 60 points, not 50.
This example is an illustration, not a real sprint. It shows why teams that face mid-sprint additions often switch to a burnup chart for stakeholder updates, even when they keep a burndown chart for the daily standup.
Which chart should you choose?
Choose a burndown chart when scope is fixed and the deadline is the main risk, and choose a burnup chart when scope may move and stakeholders need to see why. The decision takes less than a minute once you answer two questions.
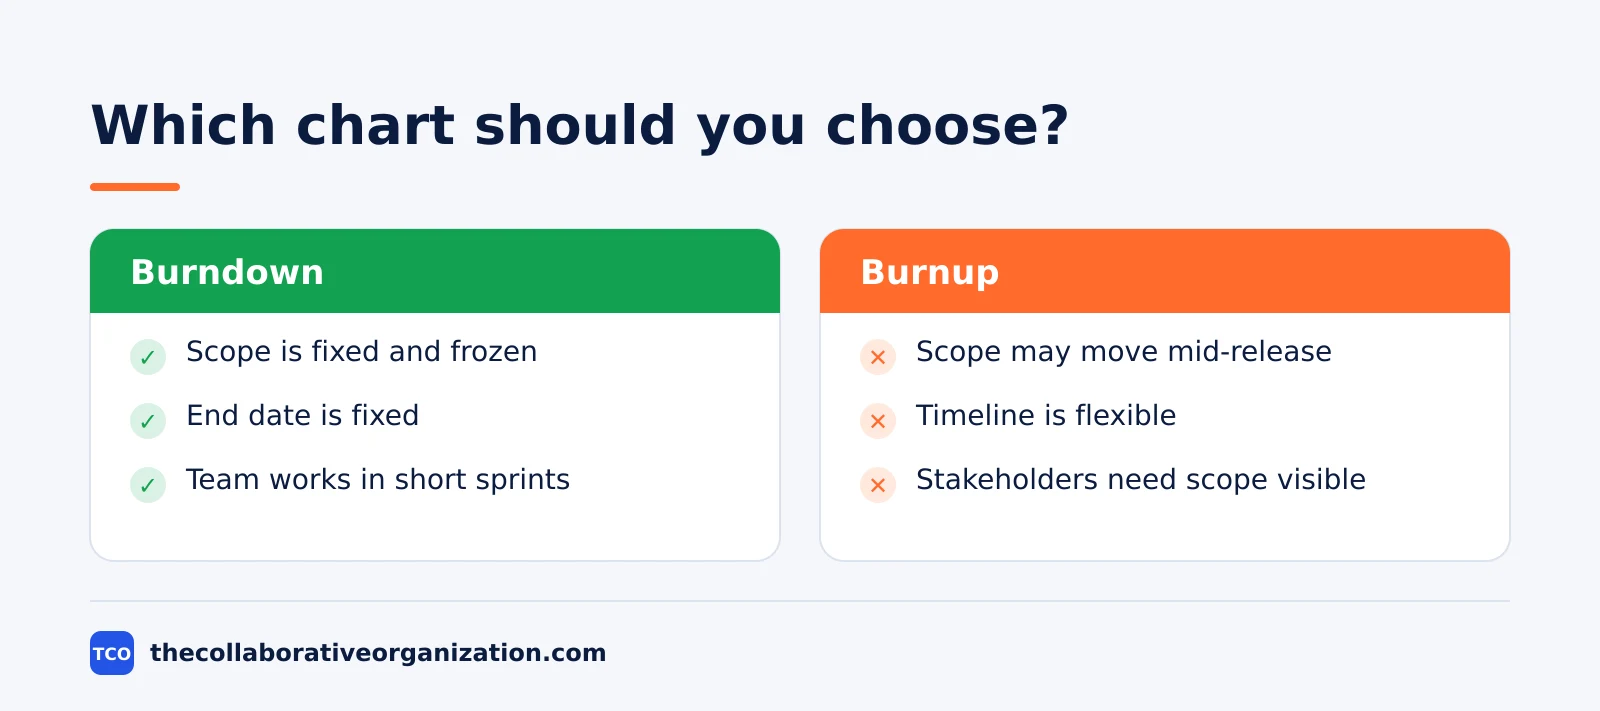
Choose a burndown chart if the scope is agreed and frozen, the end date is fixed, and the team works in short sprints. It is the simpler chart, and it makes the daily question visible: how much work is left against the days left.
Choose a burnup chart if stakeholders add work during the release, the timeline is flexible, or the project spans several sprints. It shows progress and scope as separate facts, so a scope discussion starts from evidence instead of blame.
Choose based on the audience too. A development team running a two-week sprint usually wants the burndown, because it tracks the sprint goal. A product owner reporting to stakeholders usually wants the burnup, because it shows both delivery and scope growth in one picture.
If neither condition is clear, start with the burndown for the sprint and add a burnup for the release. The two charts use the same underlying data, so running both costs little once the team tracks completed work each day.
Can you use both charts together?
Yes, many teams use both charts at once: the burndown for the sprint, and the burnup for the release. The charts answer different questions, so they rarely conflict.
Use the burndown in the daily standup. It shows the sprint at a glance, and it flags a slow day fast. Use the burnup in the sprint review and in stakeholder updates, where the question is usually about the release, not the sprint.
Microsoft supports this split in Azure DevOps, where burndown and burnup widgets sit side by side on the same dashboard. The only difference between the two widgets is that the burnup widget plots work completed and the burndown widget plots work remaining.
One warning applies: keep the unit the same on both charts. If the burndown counts story points and the burnup counts tasks, the two pictures will disagree for no good reason. Pick story points when tasks vary in size, and pick a task count only when tasks are small and similar.
How to build a burndown chart in 4 steps
Building a burndown chart takes four steps: size the work, set the timeline, draw the ideal line, then update the actual line each day. The steps below work on paper, on a whiteboard, or in a tool.
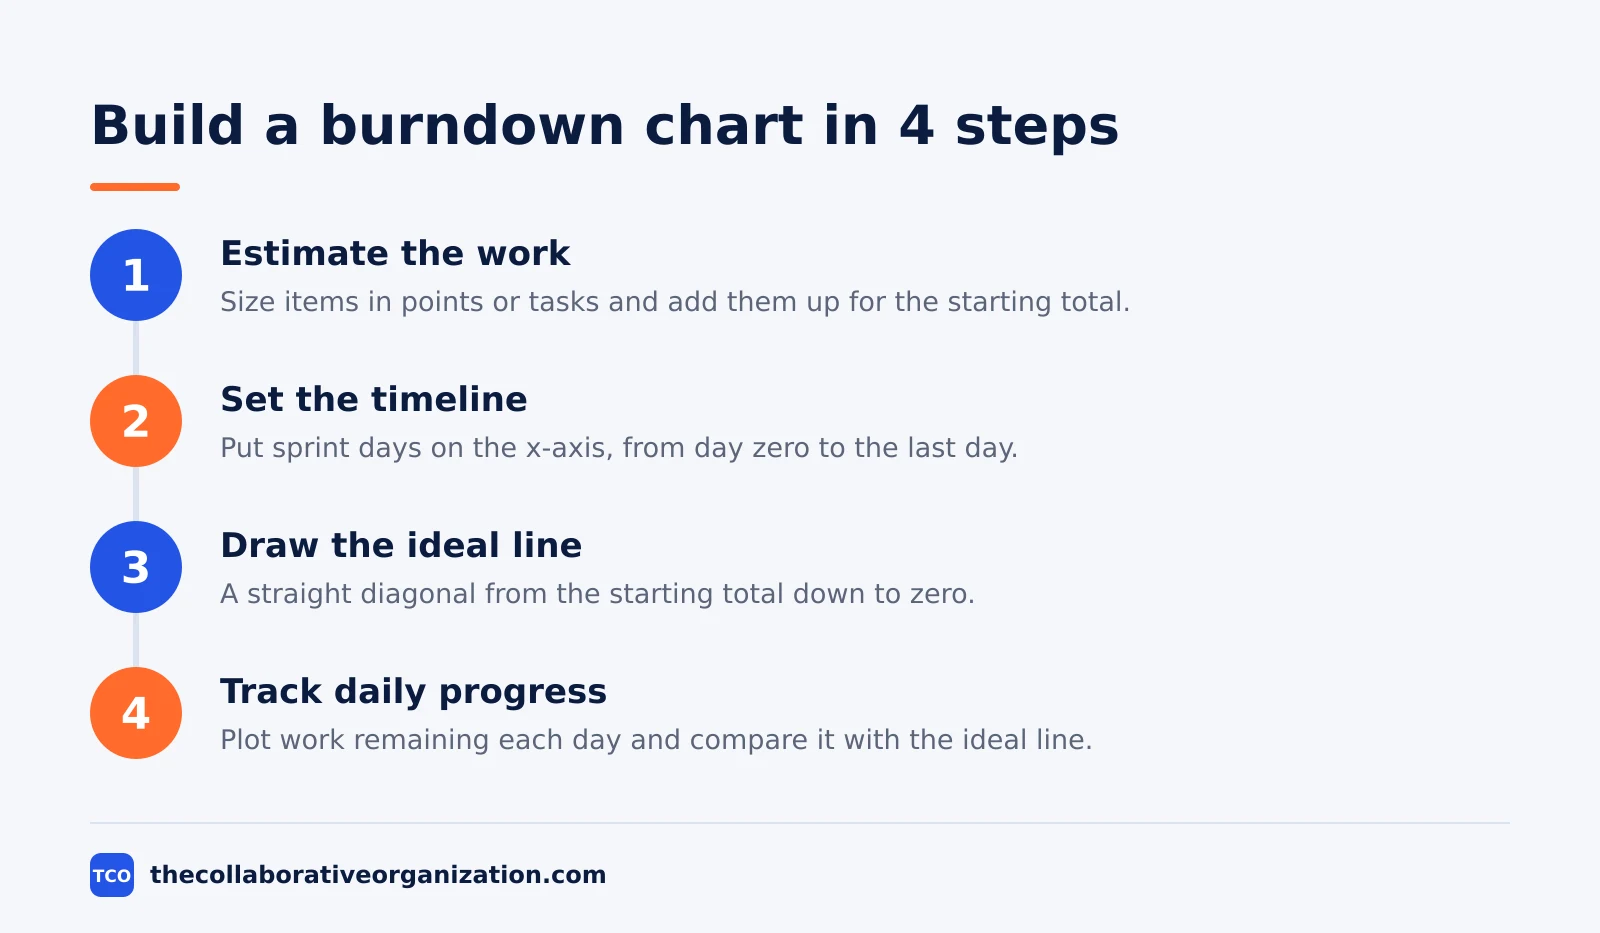
Step 1: Estimate the work
Size every item in the sprint in story points or as a task count, then add the sizes together. For example, 10 items at 5 points each gives a starting total of 50 points. Put that total at the top of the y-axis.
Step 2: Set the timeline
Put the sprint days on the x-axis, from day zero to the last day. A 10-day sprint gets 10 intervals, and each day the team plots the work still remaining.
Step 3: Draw the ideal line
Draw a straight diagonal from the starting total down to zero on the last day. This line is the pace the team needs, and it never changes during the sprint unless the scope changes.
Step 4: Track daily progress
Update the actual line each day, usually at the daily standup. Plot the work remaining after each day’s finished work, and compare it with the ideal line to see whether the team is ahead or behind.
To build a burnup chart, add one more line: plot total scope each day alongside completed work. When scope changes, move the scope line, not the completed line, so the chart keeps the two facts apart.
Tools that draw burndown and burnup charts
Most project tools draw both charts from the same board data, so pick the tool the team already uses. Our guide on how to choose project management software covers seat counts and free-plan caps before you compare prices.
Compare the options on our project management software shortlist if you have not picked a tool yet. The table below lists starting prices as of November 2026.
| Tool | Best for | Free plan | Starting price (as of November 2026) | Notable limit |
|---|---|---|---|---|
| Jira | Scrum teams that want burndown and velocity reports | Free for up to 10 users | $9.70 per user per month (Standard), billed monthly for 1-100 users | Free plan covers 10 users |
| Asana | Teams that want burndown charts next to timelines | Free for 2 people | $10.99 per user per month (Starter), billed annually | Free plan covers 2 people |
| ClickUp | Teams that want sprint charts plus a free board | Free Forever plan | $9 per user per month (Core), billed annually | Yearly billing needed for that price |
| monday.com | Teams that want dashboards with burndown widgets | Free plan for up to 2 seats | $9 per seat per month (Basic), billed annually | Paid plans need at least 3 seats |
The Jira price comes from TaskRhino, which checked Atlassian’s Jira pricing page on 10 November 2026: Free for up to 10 users, Standard at $9.70 per user per month for 1 to 100 users, and Premium at $19.60.
The Asana price comes from Asana pricing, where Starter is $10.99 per user per month billed annually.
The ClickUp pricing page lists Core at $9 per user per month billed yearly.
The monday.com pricing page lists Basic at $9 per seat per month billed annually with a 3-seat minimum.
Common burndown and burnup chart mistakes to avoid
Most burn charts fail in the same five ways, and all five come from bad data, not bad drawing. Check the list below before you trust a chart.
- Counting work as done before it meets the finish rule. A card that is coded but untested still counts as remaining work, or the chart will look better than the real state.
- Changing the unit mid-sprint. Switching from story points to task count halfway through makes the line jump for no real reason.
- Adding scope without recording it. On a burndown chart, silent scope growth looks like slow work, and the team takes blame for a decision it did not make.
- Updating the chart once a week. A burndown chart updated weekly cannot warn the team in time, because the sprint is half over before the line moves.
- Reading the chart without context. A flat line can mean blocked work, waiting on review, or a public holiday, and the chart alone cannot tell you which one it is.
Sources
- Lucid - How to Create a Burndown Chart (2026)
- Microsoft - Configure a Burndown or Burnup Widget (2026)
- Scrum Guide - The Scrum Guide (2020)
- TaskRhino - Jira Review 2026: Pricing, Pros and Cons (2026)
- Asana - Pricing (2026)
- ClickUp - Pricing (2026)
- monday.com - Pricing (2026)
- Atlassian - What Is Kanban in Project Management? (2026)
Frequently asked questions
What is the main difference between a burndown chart and a burnup chart?
A burndown chart shows one line of work remaining that falls toward zero, so it hides scope changes. A burnup chart shows two lines, completed work rising and total scope as a separate line, so a scope change shows up as a step in the scope line. Burndown is simpler, while burnup is clearer when scope may change.
Can a burndown chart show scope changes?
Not clearly. When new work is added, the remaining-work line stays flat or rises, and the chart cannot tell you whether the team slowed down or the scope grew. A burnup chart keeps scope on its own line, so added work shows up as a rise in total scope while completed work keeps its own line.
Which chart is better for a sprint with fixed scope?
A burndown chart is better for a sprint with fixed scope, because it is simpler and it answers the one question that matters: how much work is left against the days left. With fixed scope, the hidden-scope problem does not arise, so the extra line on a burnup chart adds little value.
Which chart is better for a release with changing scope?
A burnup chart is better for a release with changing scope, because it plots completed work and total scope as separate lines. Stakeholders can see how much the team finished and how much the target moved, instead of seeing one flat line that hides both facts at once.
Do burndown and burnup charts replace a sprint review?
No. Both charts show progress against a plan, but they do not show quality, feedback, or whether the work delivered real value. Use the chart to spot a problem early, then use the sprint review to inspect the finished work with stakeholders and decide what to do next.
What unit should a burn chart use: story points or task count?
Use story points when tasks vary a lot in size, because a count treats a one-hour fix and a three-day feature as equal. Use a task count only when tasks are small and similar in size. Pick one unit for the whole sprint or release, and do not switch units halfway through.
Related articles

project management
What Is a RACI Matrix? Definition, Roles and Examples (2026)
A RACI matrix maps who is Responsible, Accountable, Consulted and Informed for each task. Learn the four roles, how to build one, and see a worked example.
November 19, 2026 · 9 min read
project management
Daily Standup Meeting Format That Works (2026)
A daily standup is a 15-minute meeting where Developers inspect progress toward the Sprint Goal and plan the next day. Use this format to run one that ends on time.
November 19, 2026 · 10 min read

project management
How to Run a Sprint Planning Meeting (2026)
Sprint planning opens every sprint with a goal, a set of backlog items and a plan. Follow these 6 steps to run the meeting in 90 minutes for a two-week sprint.
November 19, 2026 · 9 min read